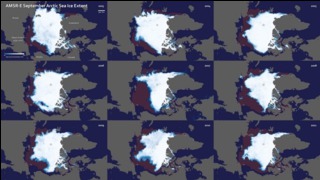
September Arctic Sea Ice
Satellite-based passive microwave images of sea ice have provided a reliable tool for continuously monitoring changes in the Arctic ice since 1979. During Northern Hemisphere spring and summer months, the Arctic sea ice melts considerably, usually reaching its minimum extent in September, before colder weather begins to cause ice cover to increase during fall and winter months. This series of images shows Arctic sea ice extent for a selection of years using data from AMSR-E and AMSR2. The burgundy area represents the median sea ice extent observed by satellite sensors in September from 1979 to 2000.
Over the last few decades, the average global temperature has been on the rise—and temperatures in the Arctic have risen at nearly twice the rate as temperatures elsewhere on the planet. As temperatures rise in the Arctic, the extent of sea ice declines. Sea ice is highly reflective of the sun’s energy; therefore, reductions in sea ice impact Earth’s radiation budget. Rather than reflecting most of the sun’s energy, ice-free areas absorb sunlight causing subsequent warming of the ocean.

September Arctic Sea Ice extent from 2010 to 2018
Selected years of September Arctic Sea Ice between 2002 and 2018
Time series animation of Sepetmber Arctic Sea Ice from 2002 to 2018
Sea ice extent anomaly plot
Credits
Please give credit for this item to:
NASA's Goddard Space Flight Center
-
Visualizer
Release date
This page was originally published on Sunday, July 31, 2016.
This page was last updated on Tuesday, November 14, 2023 at 12:32 AM EST.
Missions
This visualization is related to the following missions:Datasets used in this visualization
-
Sea Ice Concentration (Level 3 12.5 km Sea Ice Concentration) [Aqua: AMSR-E]
ID: 608 -
10 km Daily Sea Ice Concentration [SHIZUKU (GCOM-W1): AMSR2]
ID: 795Credit: AMSR2 data courtesy of the Japan Aerospace Exploration Agency (JAXA).
See all pages that use this dataset
Note: While we identify the data sets used in these visualizations, we do not store any further details, nor the data sets themselves on our site.
Older Versions
- ID: 30005
 Hyperwall Visual