A newer version of this visualization is available.
Ocean Salinity and Daily Argo Coverage
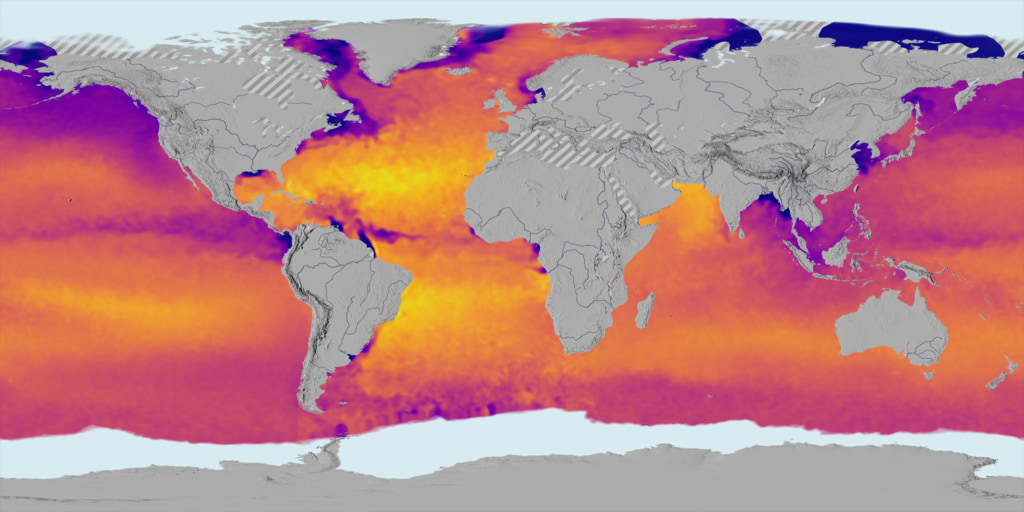
Salinity has been measured at sea for centuries, first using buckets to collect samples, and later (within the past few decades) with instruments known as “CTDs,” which simultaneously measure conductivity (as a proxy for salinity), temperature, and ocean depth (based on pressure). This technology is used to provide single point samples throughout the ocean. The Argo program has over 3500 profiling floats with CTDs currently deployed in all ocean basins. The Argo array of profiling floats is the first attempt to monitor the global subsurface (upper 2000 meters) ocean temperature and salinity fields in real time. The first floats were deployed in late 1999 and it took another 8 years to reach the global target of 3000 operating floats delivering data every 10 days. While ~3500 floats seem like a lot, on a daily basis the ocean is still very undersampled. This visualization shows ocean salinity at 150 meters as derived by an eddy-resolving ocean model. The gray dots represent the daily locations of Argo floats from January 1993 to December 2010. Ocean salinity and temperature data from Argo floats have proved extremely useful, and can be used in combination with data from other sources (such as from NASA’s Aquarius mission and other satellite missions) to observe and model long-term ocean signals related to climate change.
Modeled ocean salinity and daily locations of Argo floats, 1993 to 2010.
For More Information
Credits
Please give credit for this item to:
PODAAC
-
Technical support
-
Project support
- Jessica Hausman (NASA/JPL CalTech)
Release date
This page was originally published on Tuesday, May 13, 2014.
This page was last updated on Tuesday, November 14, 2023 at 12:26 AM EST.
Datasets used in this visualization
-
[Argo Buoy]
ID: 165
Note: While we identify the data sets used in these visualizations, we do not store any further details, nor the data sets themselves on our site.
Newer Versions
- ID: 5017
 Visualization