A newer version of this visualization is available.
Measuring Soil Moisture from Space
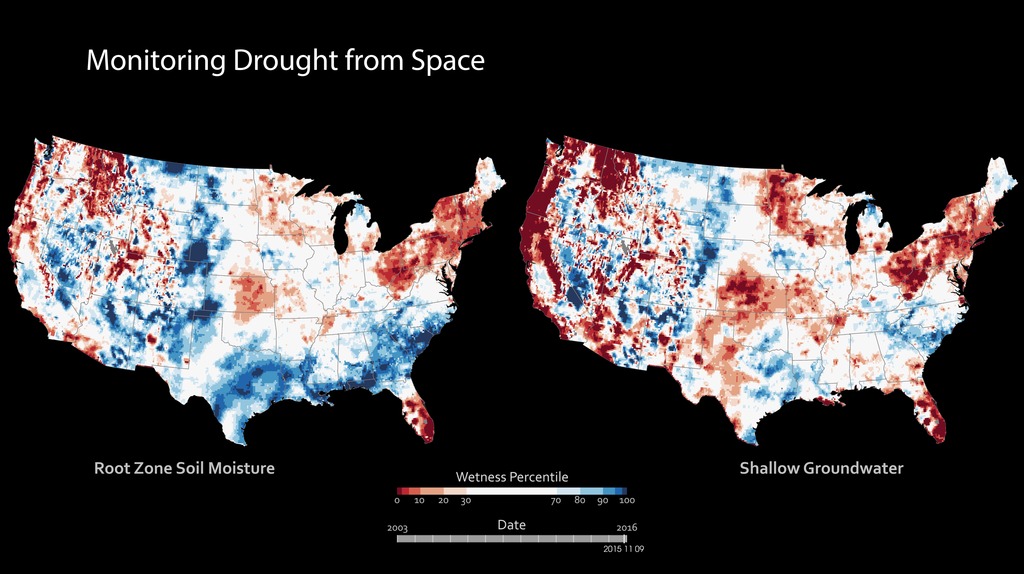
These maps combine data from the twin satellites of the Gravity Recovery and Climate Experiment (GRACE) with other satellite and ground-based measurements to model the relative amount of water stored at three different levels: at the surface, at plant root level and underground from January 2003 to December 2014. The wetness, or water content, of each layer is compared to the average between 1948 and 2009. The darkest red regions represent dry conditions that should occur only 2 percent of the time (about once every 50 years). All of the maps are experimental products funded by NASA’s Applied Sciences Program and developed by scientists at NASA’s Goddard Space Flight Center and the National Drought Mitigation Center. The maps do not attempt to represent human consumption of water; but rather, they show changes in water storage related to weather, climate, and seasonal patterns.
Soil moisture at various depths is found from ground- and space-based data
Soil moisture in the root zone compared o ground water storage.
A Soil Surface Moisture map showing moisture content in the top 2 centimeters of surface soil.
A Root Zone Soil Moisture map showing moisture content in the “root zone,” or the top meter (39 inches) of soil.
A Ground Water Storage map showing groundwater in aquifers.
For More Information
Credits
Please give credit for this item to:
NASA
-
Project support
- Marit Jentoft-Nilsen
- Mark Malanoski (Global Science and Technology, Inc.)
-
Writer
- Heather Hanson (Global Science and Technology, Inc.)
Release date
This page was originally published on Thursday, October 17, 2013.
This page was last updated on Tuesday, November 14, 2023 at 12:23 AM EST.
Missions
This visualization is related to the following missions:Datasets used in this visualization
-
[Gravity Recovery and Climate Experiment (GRACE)]
ID: 221
Note: While we identify the data sets used in these visualizations, we do not store any further details, nor the data sets themselves on our site.
Newer Versions
- ID: 30730
 Hyperwall Visual