Atmospheric Water Vapor during the 1998 La Niña (WMS)
Water vapor is a small but significant constituent of the atmosphere, warming the planet due to the greenhouse effect and condensing to form clouds which both warm and cool the Earth in different circumstances. A key feature of global atmospheric water vapor convection is the Intertropical Convergence Zone, the low pressure region within five degrees of the equator where the trade winds converge and solar heating of the atmosphere forces the water-laden air to rise in altitude, form clouds, and then precipitate as rain in the afternoon. This visualization shows the global water vapor distribution in gray and white and the global precipitation in yellow every hour from August 30, 1998 to September 20, 1998. The afternoon thunderstorms in the tropics are seen as a flashing yellow region that moves from east to west, following the sun. This is a La Niña period, when the water to the west of South America is cooler than normal, forcing the atmosphere there to cool down and hold less water. Strong east-to-west winds can be seen in this region, contributing to the high water vapor region that forms further to the west over southeast Asia, the Philippines, and Indonesia, causing increased humidity and rainfall in that region. This data is from the Goddard Earth Modeling System, a coupled land-ocean-atmosphere model which uses earth and satellite-based observations to simulate the Earth's physical system during events such as La Niña.
This visualization shows the total precipitable water in the atmosphere, indicated by the gray to white cloud-like structures, and predicted precipitation, indicated by gold, during the 1998-1999 La Niña.
This product is available through our Web Map Service.
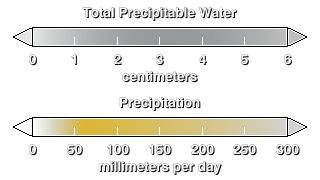
Legend for the water vapor animation, showing separate colorbars for the total precipitable water and the precipitation.
For More Information
Credits
Please give credit for this item to:
NASA/Goddard Space Flight Center
Scientific Visualization Studio
-
Animators
- Eric Sokolowsky (Global Science and Technology, Inc.)
- John Waldrop (NASA)
- Horace Mitchell (NASA/GSFC)
-
Scientist
- David Adamec (NASA/GSFC)
Release date
This page was originally published on Thursday, February 12, 2004.
This page was last updated on Wednesday, May 3, 2023 at 1:56 PM EDT.