Parker Solar Probe First Findings - Media Telecon
NASA to Present First Parker Solar Probe Findings in Media Teleconference
NASA will announce the first results from the Parker Solar Probe mission, the agency's mission to "touch" the Sun, during a media teleconference at 1:30 pm EST on Wednesday, Dec. 4, 2019.
Parker has traveled closer to our star than any human-made object before it. The teleconference will discuss the first papers from the principal investigators of the mission’s four instruments. The papers will be published online Wednesday in Nature at 1 pm EST.
The teleconference audio will stream live at:
https://www.nasa.gov/nasalive
Participants in the call are:
• Nicola Fox, director of the Heliophysics Division, Science Mission Directorate, NASA Headquarters, Washington
• Stuart Bale, principal investigator of the FIELDS instrument at the University of California, Berkeley
• Justin Kasper, principal investigator of the SWEAP instrument at the University of Michigan in Ann Arbor
• Russ Howard, principal investigator of the WISPR instrument at the Naval Research Laboratory in Washington
• David McComas, principal investigator of the ISʘIS instrument at Princeton University in Princeton, N.J.
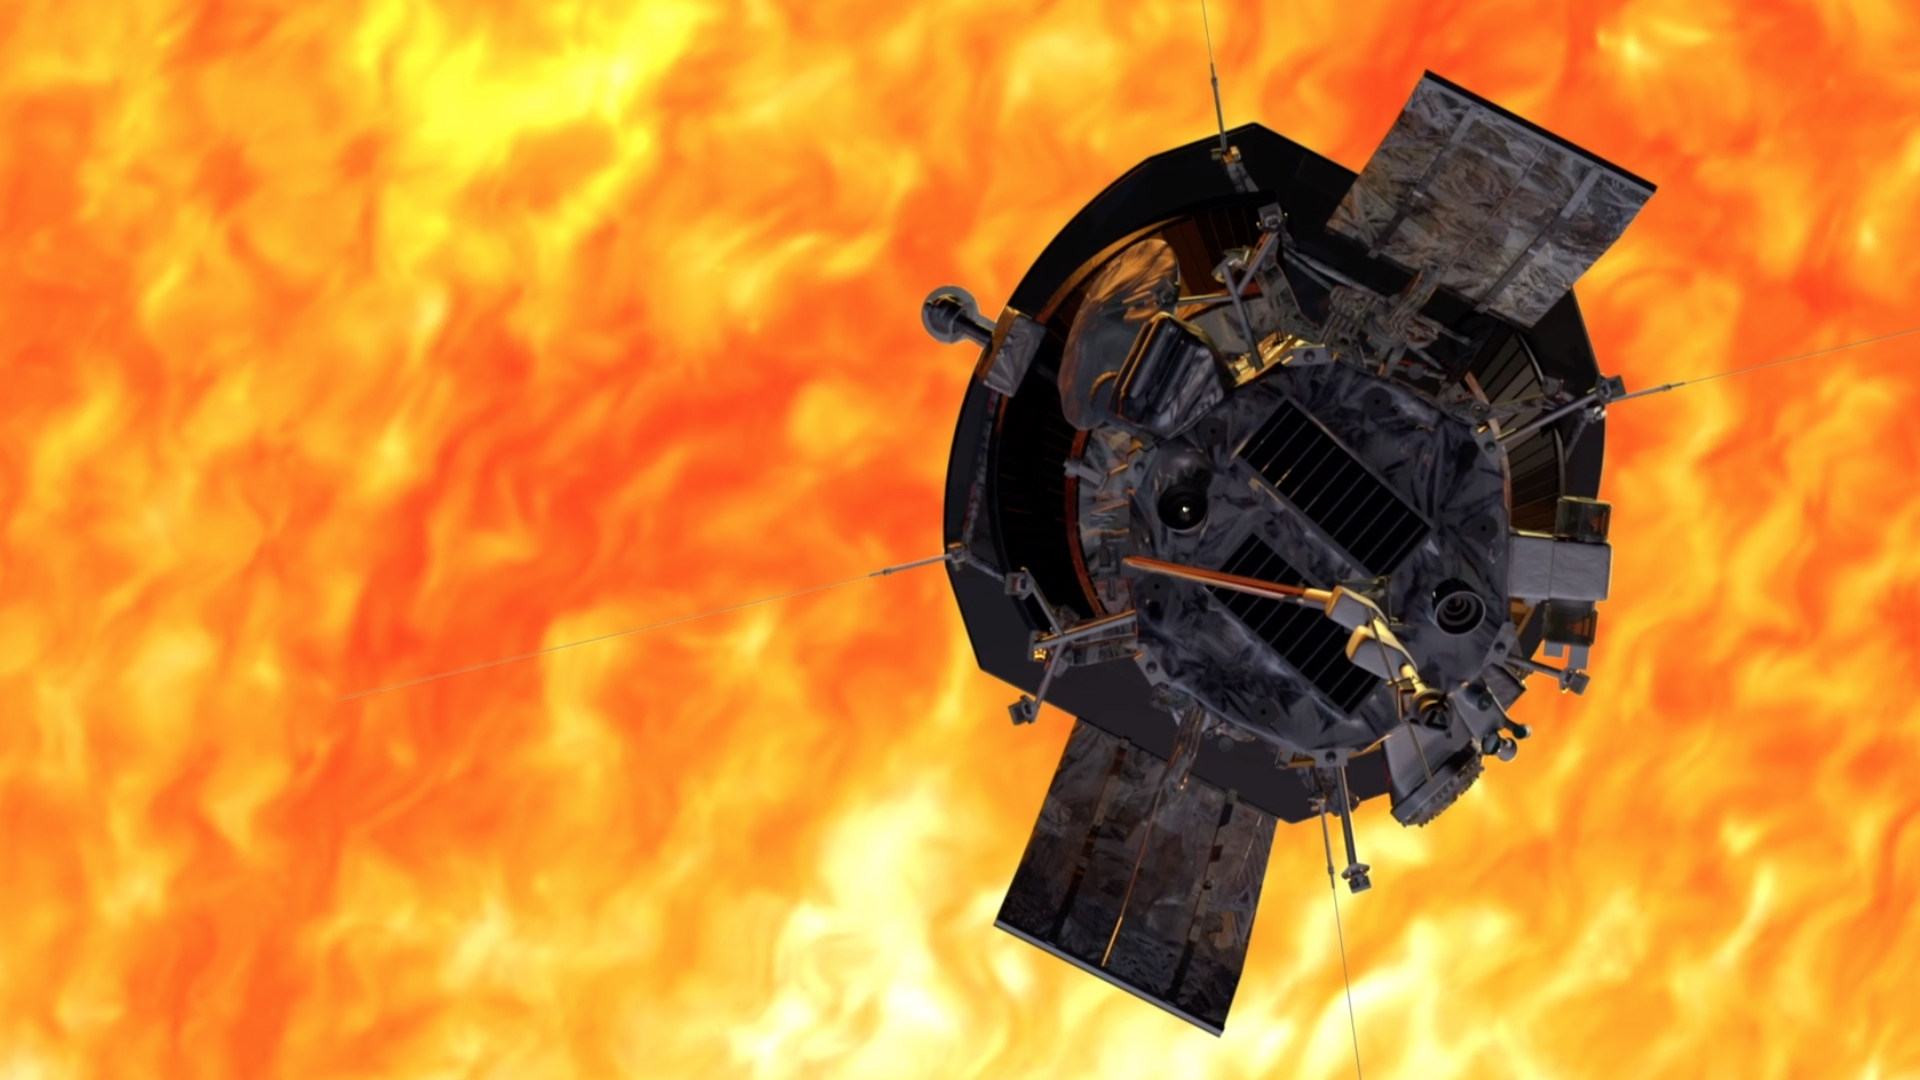
Image #1: First results from NASA's Parker Solar Probe show flips in the direction of the magnetic field, which flows out from the Sun, embedded in the solar wind and detected by the FIELDS instrument. During a switchback, the magnetic field whips back on itself until it is pointed almost directly back at the Sun. These switchbacks, along with other observations of the solar wind, may provide early clues about what mechanisms heat the solar corona and accelerate the solar wind.
Credit: NASA/Goddard/CIL
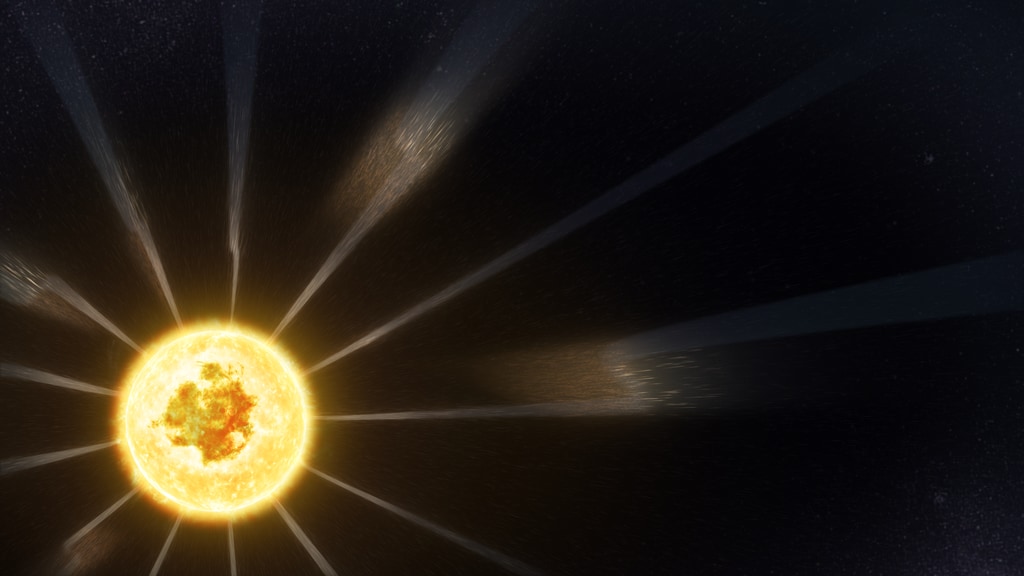
Image #2: Flips in the Sun's magnetic fields — dubbed "switchbacks" — appear to be a very common phenomenon in the solar wind flow inside the orbit of Mercury, and last anywhere from a few seconds to several minutes as they flow over NASA's Parker Solar Probe during its first year in orbit. Yet they seem not to be present any further from the Sun – we would have no way of spotting them without flying directly through that solar wind the way Parker has.
Credit: NASA/Goddard/CIL

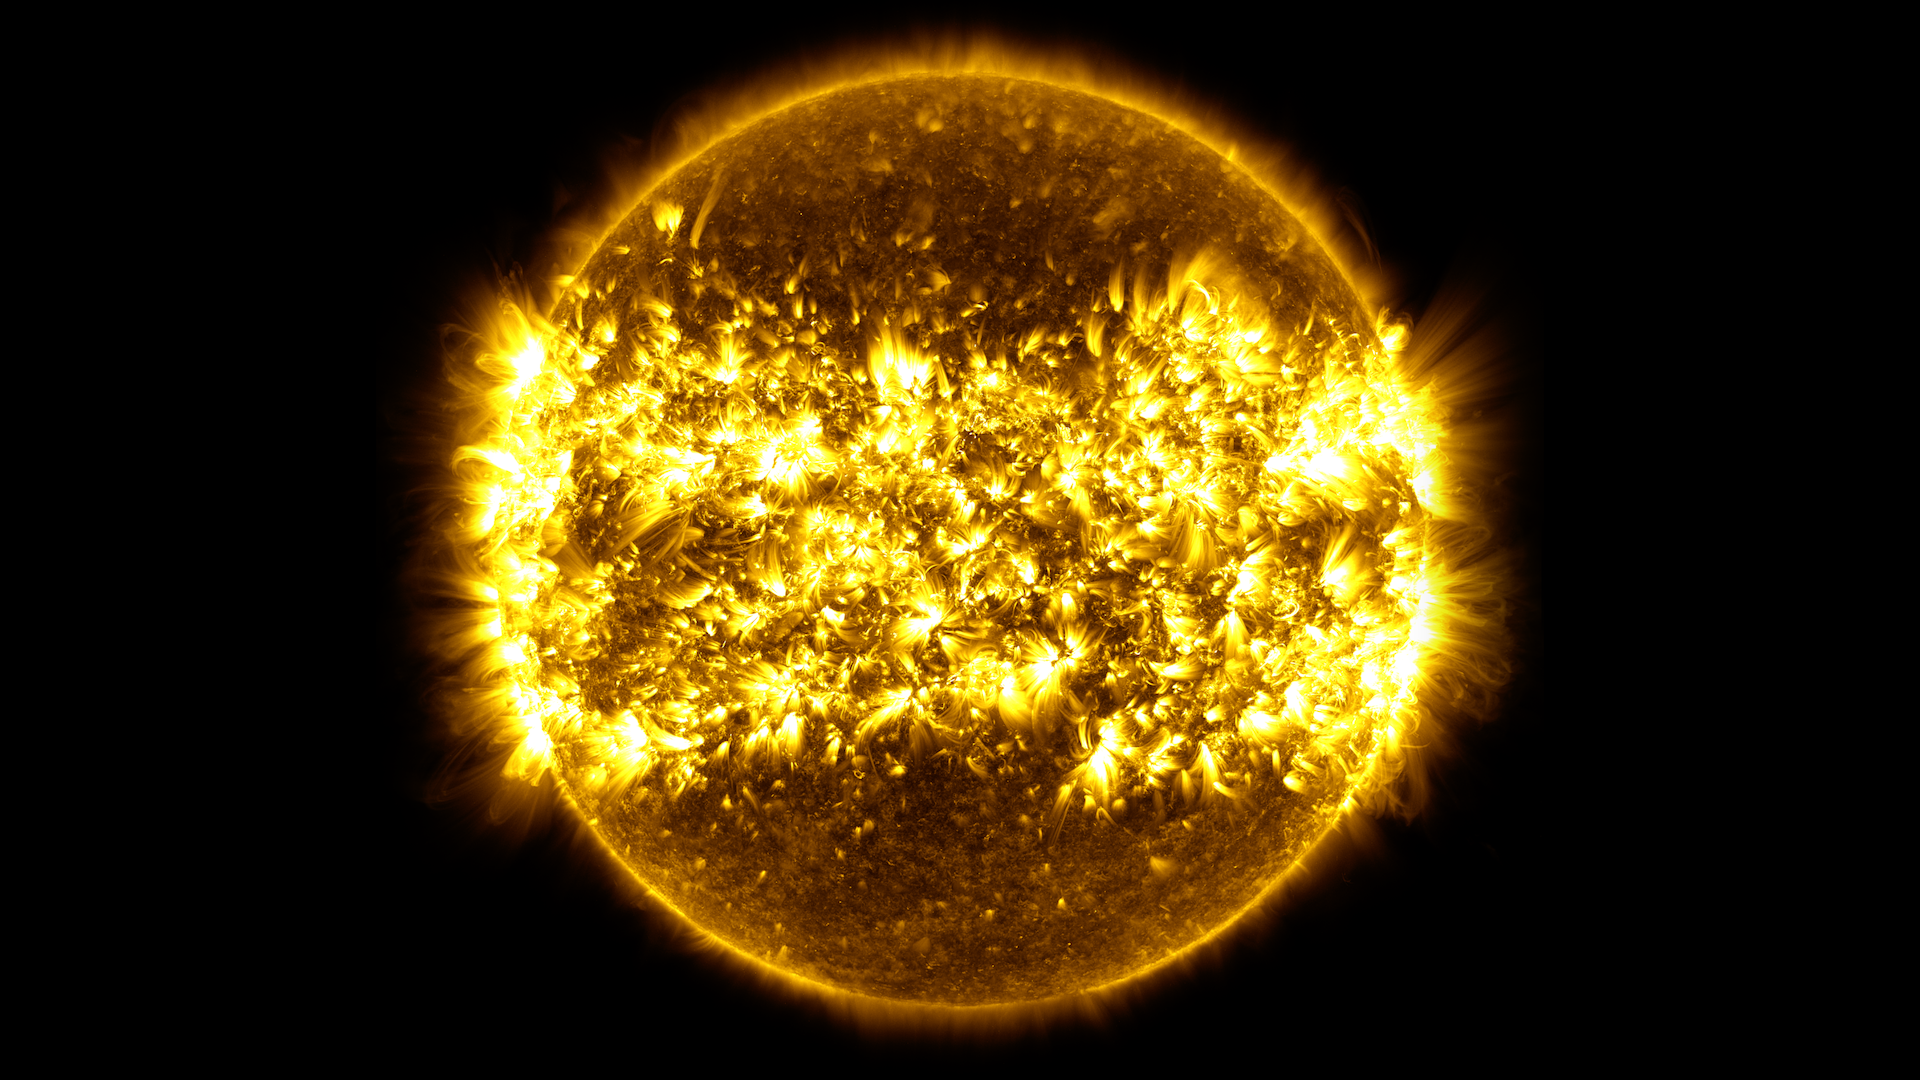
Image #3: NASA's Parker Solar Probe observed a slow solar wind flowing out from the small coronal hole — the long, thin black spot seen on the left side of the Sun in this image captured by NASA's Solar Dynamics Observatory — on October 27, 2018. While scientists have long known that fast solar wind streams flow from coronal holes near the poles, they have not yet conclusively identified the source of the Sun's slow solar wind.
Credit: NASA/SDO
Image #4: This movie shows six years of observations of the Sun as observed by NASA's Solar Dynamics Observatory. Solar particles outline loops on the horizon, illustrating the constant dance of the Sun's magnetic fields.
Credit: NASA/Goddard/SDO
Image #5: The WISPR instrument on NASA's Parker Solar Probe captured imagery of the constant outflow of material from the Sun during its close approach to the Sun in November 2018.
Credit: NASA/NRL/APL
Image #6: The WISPR image on NASA's Parker Solar Probe captured imagery of the constant outflow of material from the Sun during its close approach to the Sun in April 2019.
Credit: NASA/NRL/APL

Image #7: The Sun is surrounded by a ring of dust, made of the cosmic crumbs of collisions that formed planets, asteroids, comets and other celestial bodies billions of years ago. On clear nights, observers from Earth can see a hint of this dust — known as Zodiacal dust or "false dawn," — as a concentrated illuminated cloud appearing over the horizon, scattering the Sun's light back to us in the dark. New results from NASA's Parker Solar Probe have observed for the first time the way the dust begins to thin out near the Sun, evaporating in the intense heat. As Parker gets closer it may well see the dust disappear completely.
Image credit: ESO/Y.Beletsky
Image #8: Artist interpretation of a dust-free zone around the Sun.
Credit: NASA Goddard
Image #9: Parker's ISOIS energetic particle instruments have measured several never-before-seen events so small that all trace of them is lost before they reach Earth. These instruments have also measured a rare type of particle burst with a particularly high ratio of heavier elements — suggesting that both types of events may be more common than scientists previously thought. Solar energetic particle events are important to understand as they can arise suddenly and lead to space weather conditions near Earth that can be potentially harmful to astronauts. Unraveling the sources, acceleration, and transport of solar energetic particles will help us better protect humans in space in the future.
Credit: NASA/Goddard
 represent an increase in the number of these high-energy particles hitting the ISʘIS sensors. (Time in days is given on the horizontal axis, and particle energy on the vertical axis.) Bottom: An artist’s representation of one of these energetic particle events.
Credit: NASA/Princeton")
Image #10: One of the greatest threats from the Sun — to astronauts and the satellites that provide GPS maps, cell phone service, and internet access — are high-energy particles that erupt from the Sun in bursts. Top: On Nov. 17, 2018 — the 321st day of that year, as seen on the bottom axis — the ISʘIS instrument aboard NASA's Parker Solar Probe observed a burst of high-energy protons, each with more than 1 million electron-volts of energy. The warmer colors (yellow, orange, red) represent an increase in the number of these high-energy particles hitting the ISʘIS sensors. (Time in days is given on the horizontal axis, and particle energy on the vertical axis.) Bottom: An artist’s representation of one of these energetic particle events.
Credit: NASA/Princeton
 Here, data from orbits 1 (left) and 2 (right) show the ISʘIS particle count rates overlaid as color strips along the black line that represents the trajectory of Parker Solar Probe. The lower energy (“Lo”) rates can be seen on the inside of the track, while the higher energy (“Hi”) rates run on the outside of the track. Both the width and color correspond to the measured rates, such that large red bars indicate the biggest bursts, when the sun released the most particles in a short amount of time.
Credit: NASA/Princeton/APL")
Image #11: During Parker Solar Probe’s first two orbits, ISʘIS detected many small energetic particle events, solar bursts during which the rates of particles streaming out of the sun increased rapidly. On ISʘIS, the Epi-Lo instrument measures particles in the tens of thousands of electron-volts, while Epi-Hi measures particles with millions to hundreds of millions of electron-volts. (For reference, the electricity in your house is 120 volts.) Here, data from orbits 1 (left) and 2 (right) show the ISʘIS particle count rates overlaid as color strips along the black line that represents the trajectory of Parker Solar Probe. The lower energy (“Lo”) rates can be seen on the inside of the track, while the higher energy (“Hi”) rates run on the outside of the track. Both the width and color correspond to the measured rates, such that large red bars indicate the biggest bursts, when the sun released the most particles in a short amount of time.
Credit: NASA/Princeton/APL
Image #12: The top panel shows a schematic of a Coronal Mass Ejection (CME), during which a burst of material with as much mass as Lake Michigan is ejected from the Sun. These can pose a threat to astronauts and space satellites, but ISʘIS scientists discovered that tiny energetic particles rush ahead of the ejected mass, providing advance warning of the incoming threat.
Image #13: The bottom panel shows an ISʘIS time-series spectrogram of proton fluxes from EPI-Lo (top) and the magnetic field measurements (bottom) during an observed CME. The energetic particles preceded the CME, reaching Parker Solar Probe nearly a day before the ejected mass.
Credit: NASA/Princeton/APL

Image #14: On Epi-Lo, 80 tiny telescopes are looking in 80 different directions, and one of those was punctured by a dust grain when Parker Solar Probe was at its closest approach to the sun. The purple arrow shows the approximate arrival direction of the dust grain, and the bottom panel shows where during the second orbit collision occurred.
Credit: NASA/Princeton
Credits
Please give credit for this item to:
NASA's Goddard Space Flight Center. However, individual items should be credited as indicated above.
-
Communications lead
- Karen Fox (ADNET Systems, Inc.)
-
Science writer
- Sarah Frazier (ADNET Systems, Inc.)
-
Producers
- Genna Duberstein (USRA)
- Scott Wiessinger (USRA)
- Joy Ng (USRA)
-
Director
- Nicola Fox (NASA)
-
Scientists
- Dave McComas (SwRI)
- Russ Howard (NRL)
- Stuart Bale (University of California, Berkeley)
- Justin Kasper (University of Michigan)
Missions
This page is related to the following missions:Related
- ID: 13282
 Produced Video
 - ID: 13457
 Produced Video
 - ID: 20299
 Animation
 - ID: 12144
 Produced Video
Release date
This page was originally published on Wednesday, December 4, 2019.
This page was last updated on Sunday, February 2, 2025 at 12:22 AM EST.