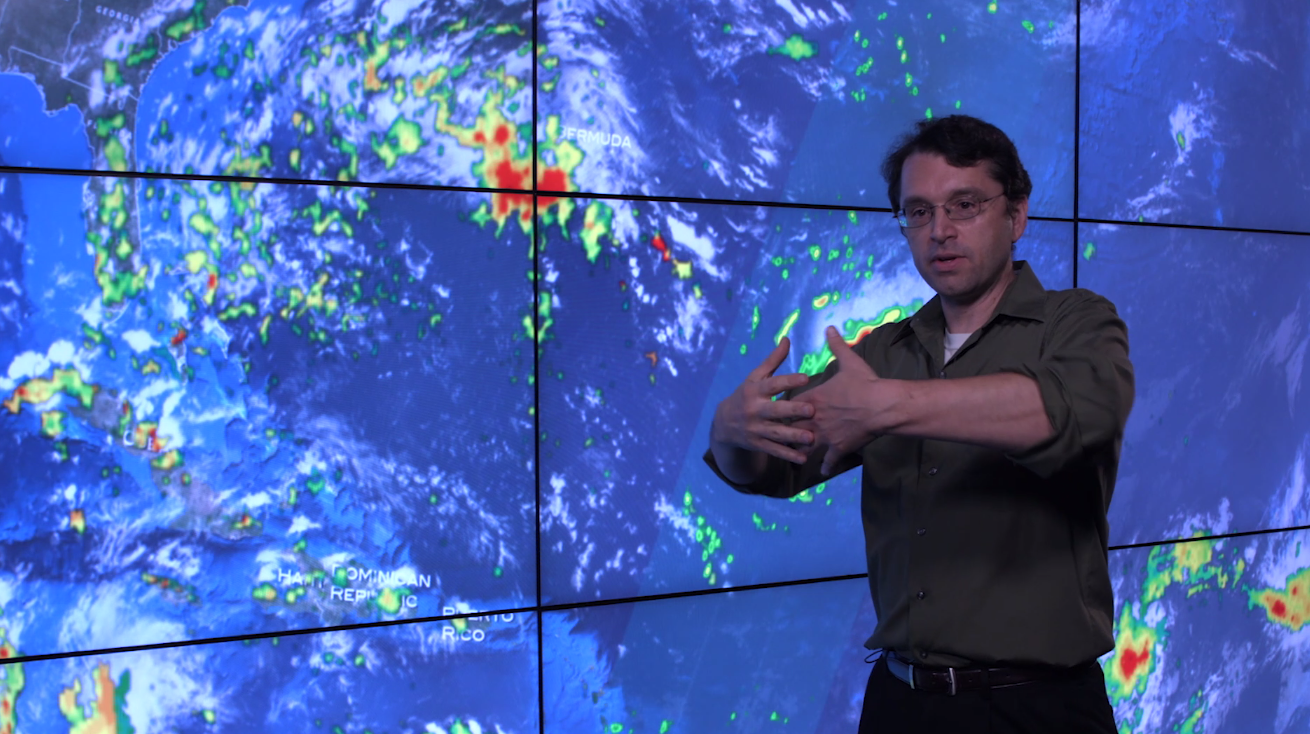
Inside Hurricane Maria in 360°
Two days before Hurricane Maria devastated Puerto Rico, the NASA-Japan Global Precipitation Measurement Core Observatory satellite captured a 3-D view of the storm. At the time Maria was a Category 1 hurricane. The 3-D view reveals the processes inside the hurricane that would fuel the storm’s intensification to a category 5 within 24 hours.
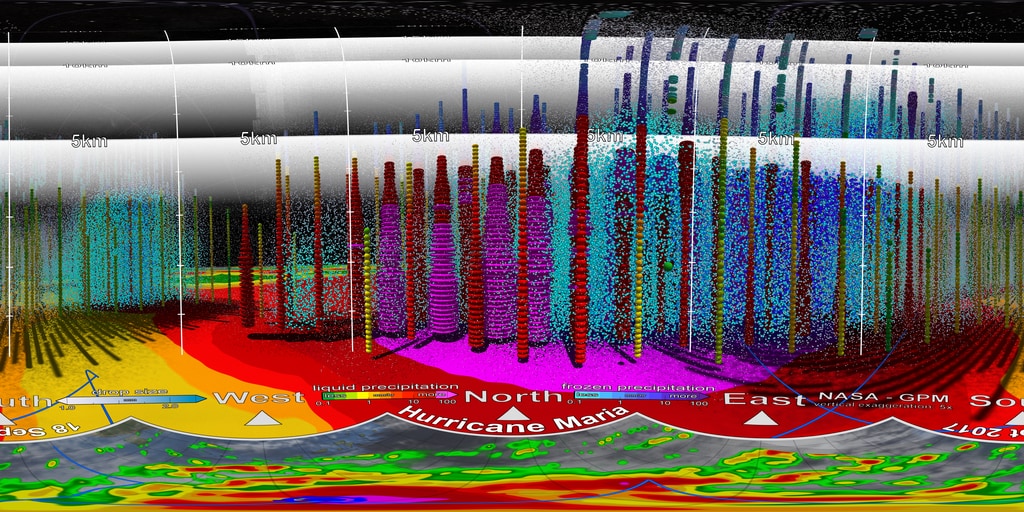
For the first time in 360-degrees, this data visualization takes you inside the hurricane. The precipitation satellite has an advanced radar that measures both liquid and frozen water. The brightly colored dots show areas of rainfall, where green and yellow show low rates and red and purple show high rates. At the top of the hurricane, where temperatures are colder, blue and purple dots show light and heavy frozen precipitation. The colored areas below the dots show how much rain is falling at the surface.
Created by: NASA's Scientific Visualization Studio and NASA's Goddard Space Flight Center
Data Sources:
• NASA/GPM Dual Precipitation Radar (DPR) precipitation rate and drop size distribution data
• NASA/GPM GPM Microwave Imager (GMI) ground precipitation data
• NASA/Bluemarble land imagery
• NOAA/GOES16 cloud data
• Hipparcos/Telescope/Tycho 2 Catalogue
This is a 360° video that can be downloaded and viewed on 360° video platforms such as YouTube and Facebook.
Complete transcript available.
Music credit: "The Answer" by Laurent Levesque [SACEM] from Killer Tracks

A GIF optimized for Twitter.

A still image for social media.
Credits
Please give credit for this item to:
NASA's Goddard Space Flight Center
Data provided by the joint NASA/JAXA GPM mission
-
Data visualizers
- Greg Shirah (NASA/GSFC)
-
Kel Elkins
(USRA)

-
Alex Kekesi
(Global Science and Technology, Inc.)
- Horace Mitchell (NASA/GSFC)
-
Scientists
- George Huffman (NASA/GSFC)
- Dalia B Kirschbaum (NASA/GSFC)
- Stephen J. Munchak (University of Maryland)
- Scott Braun (NASA/GSFC)
-
Producers
- Joy Ng (USRA)
- Ryan Fitzgibbons (USRA)
-
Writer
- Ellen T. Gray (ADNET Systems, Inc.)
-
Technical support
- Laurence Schuler (ADNET Systems, Inc.)
- Ian Jones (ADNET Systems, Inc.)
- Aaron E. Lepsch (ADNET Systems, Inc.)
-
Support
- Joycelyn Thomson Jones (NASA/GSFC)
- Leann Johnson (Global Science and Technology, Inc.)
Missions
This page is related to the following missions:Series
This page can be found in the following series:Related
- ID: 13071
 Produced Video
 - ID: 12126
- ID: 4285
Sources
- ID: 4685
 Visualization
Release date
This page was originally published on Thursday, October 4, 2018.
This page was last updated on Wednesday, May 3, 2023 at 1:46 PM EDT.