For 15 Years, GRACE Tracked Freshwater Movements Around the World
NASA scientists used GRACE data to identify regional trends of freshwater movement, and combined that information with data from other satellites, climate models and precipitation measurements to determine the causes of major regional trends in freshwater storage.
The Gravity Recovery and Climate Experiment, or GRACE mission, used precise measurements of the motions of two spacecraft in Earth’s orbit to track the movement of water through the oceans, land, and atmosphere.
Music: Iron Throne by Anthony Giordano [SACEM]
Complete transcript available.
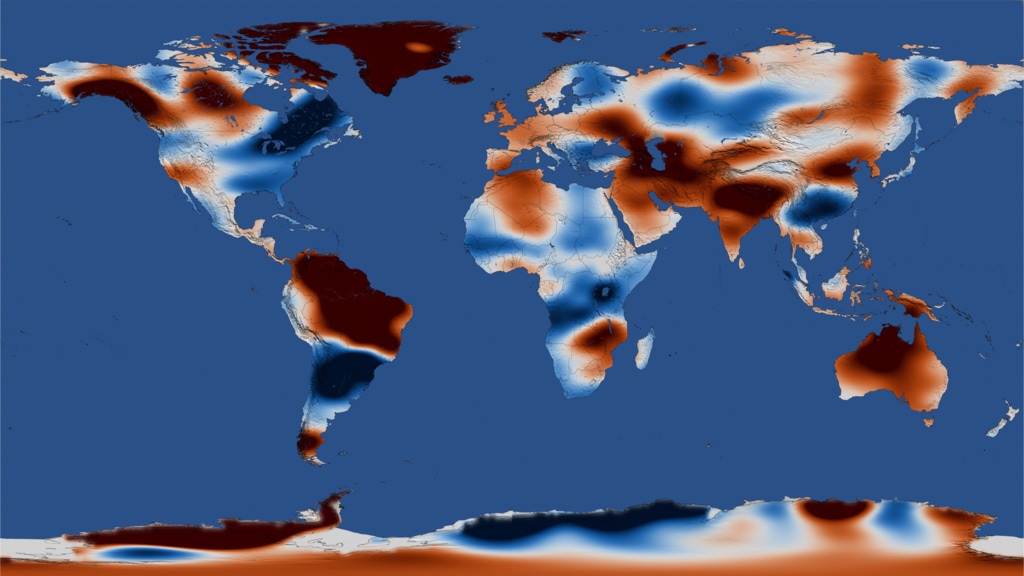
Between 2002 and 2016, the Gravity Recovery and Climate Experiment (GRACE) tracked the movement of freshwater around the planet.
Music: Iron Throne by Anthony Girodano [SACEM]
Complete transcript available.
Natural variability played a significant role in groundwater depletion in California.
Music: Iron Throne by Anthony Giordano [SACEM]
Complete transcript available.
An increase in rainfall in the Okavongo Delta during the period of the GRACE mission ended a regional drought.
Music: Iron Throne by Anthony Giordano [SACEM]
Complete transcript available.
Increased irrigation in Saudi Arabia led to depleted groundwater in the desert.
Music: Iron Throne by Anthony Giordano [SACEM]
Complete transcript available.
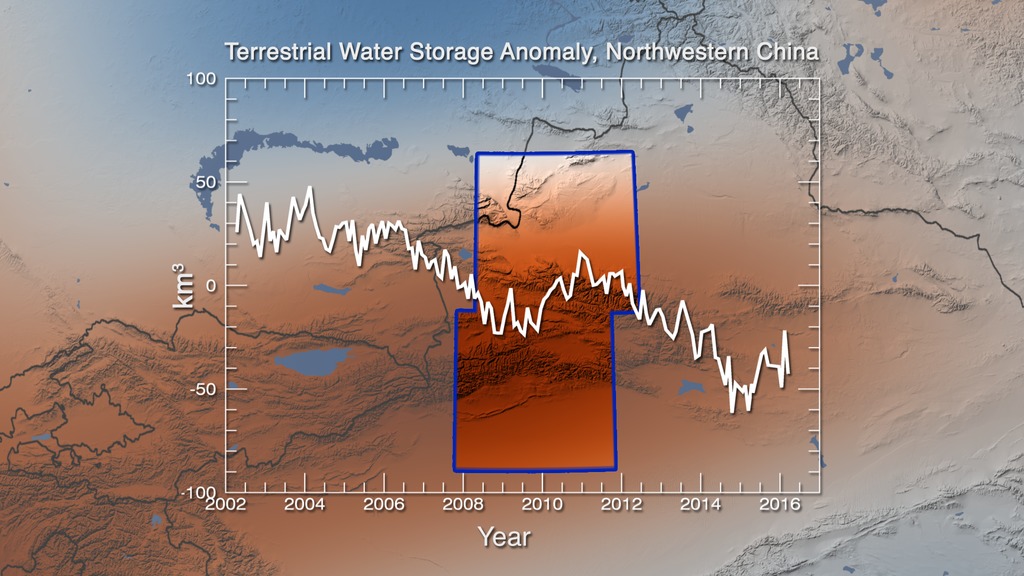
Multiple factors, including human activity and melting glaciers, combined to deplete groundwater in northwest China.
Music: Iron Throne by Anthony Giordano [SACEM]
Complete transcript available.
Complete transcript available.
In late spring 2018, NASA is launching a new satellite pair, GRACE Follow-On, to continue studying water movement around the planet.
Music: Iron Throne by Anthony Giordano [SACEM]
Complete transcript available.
Time series of freshwater increases above average in blue and decreases below average in red from 2002 to 2016.
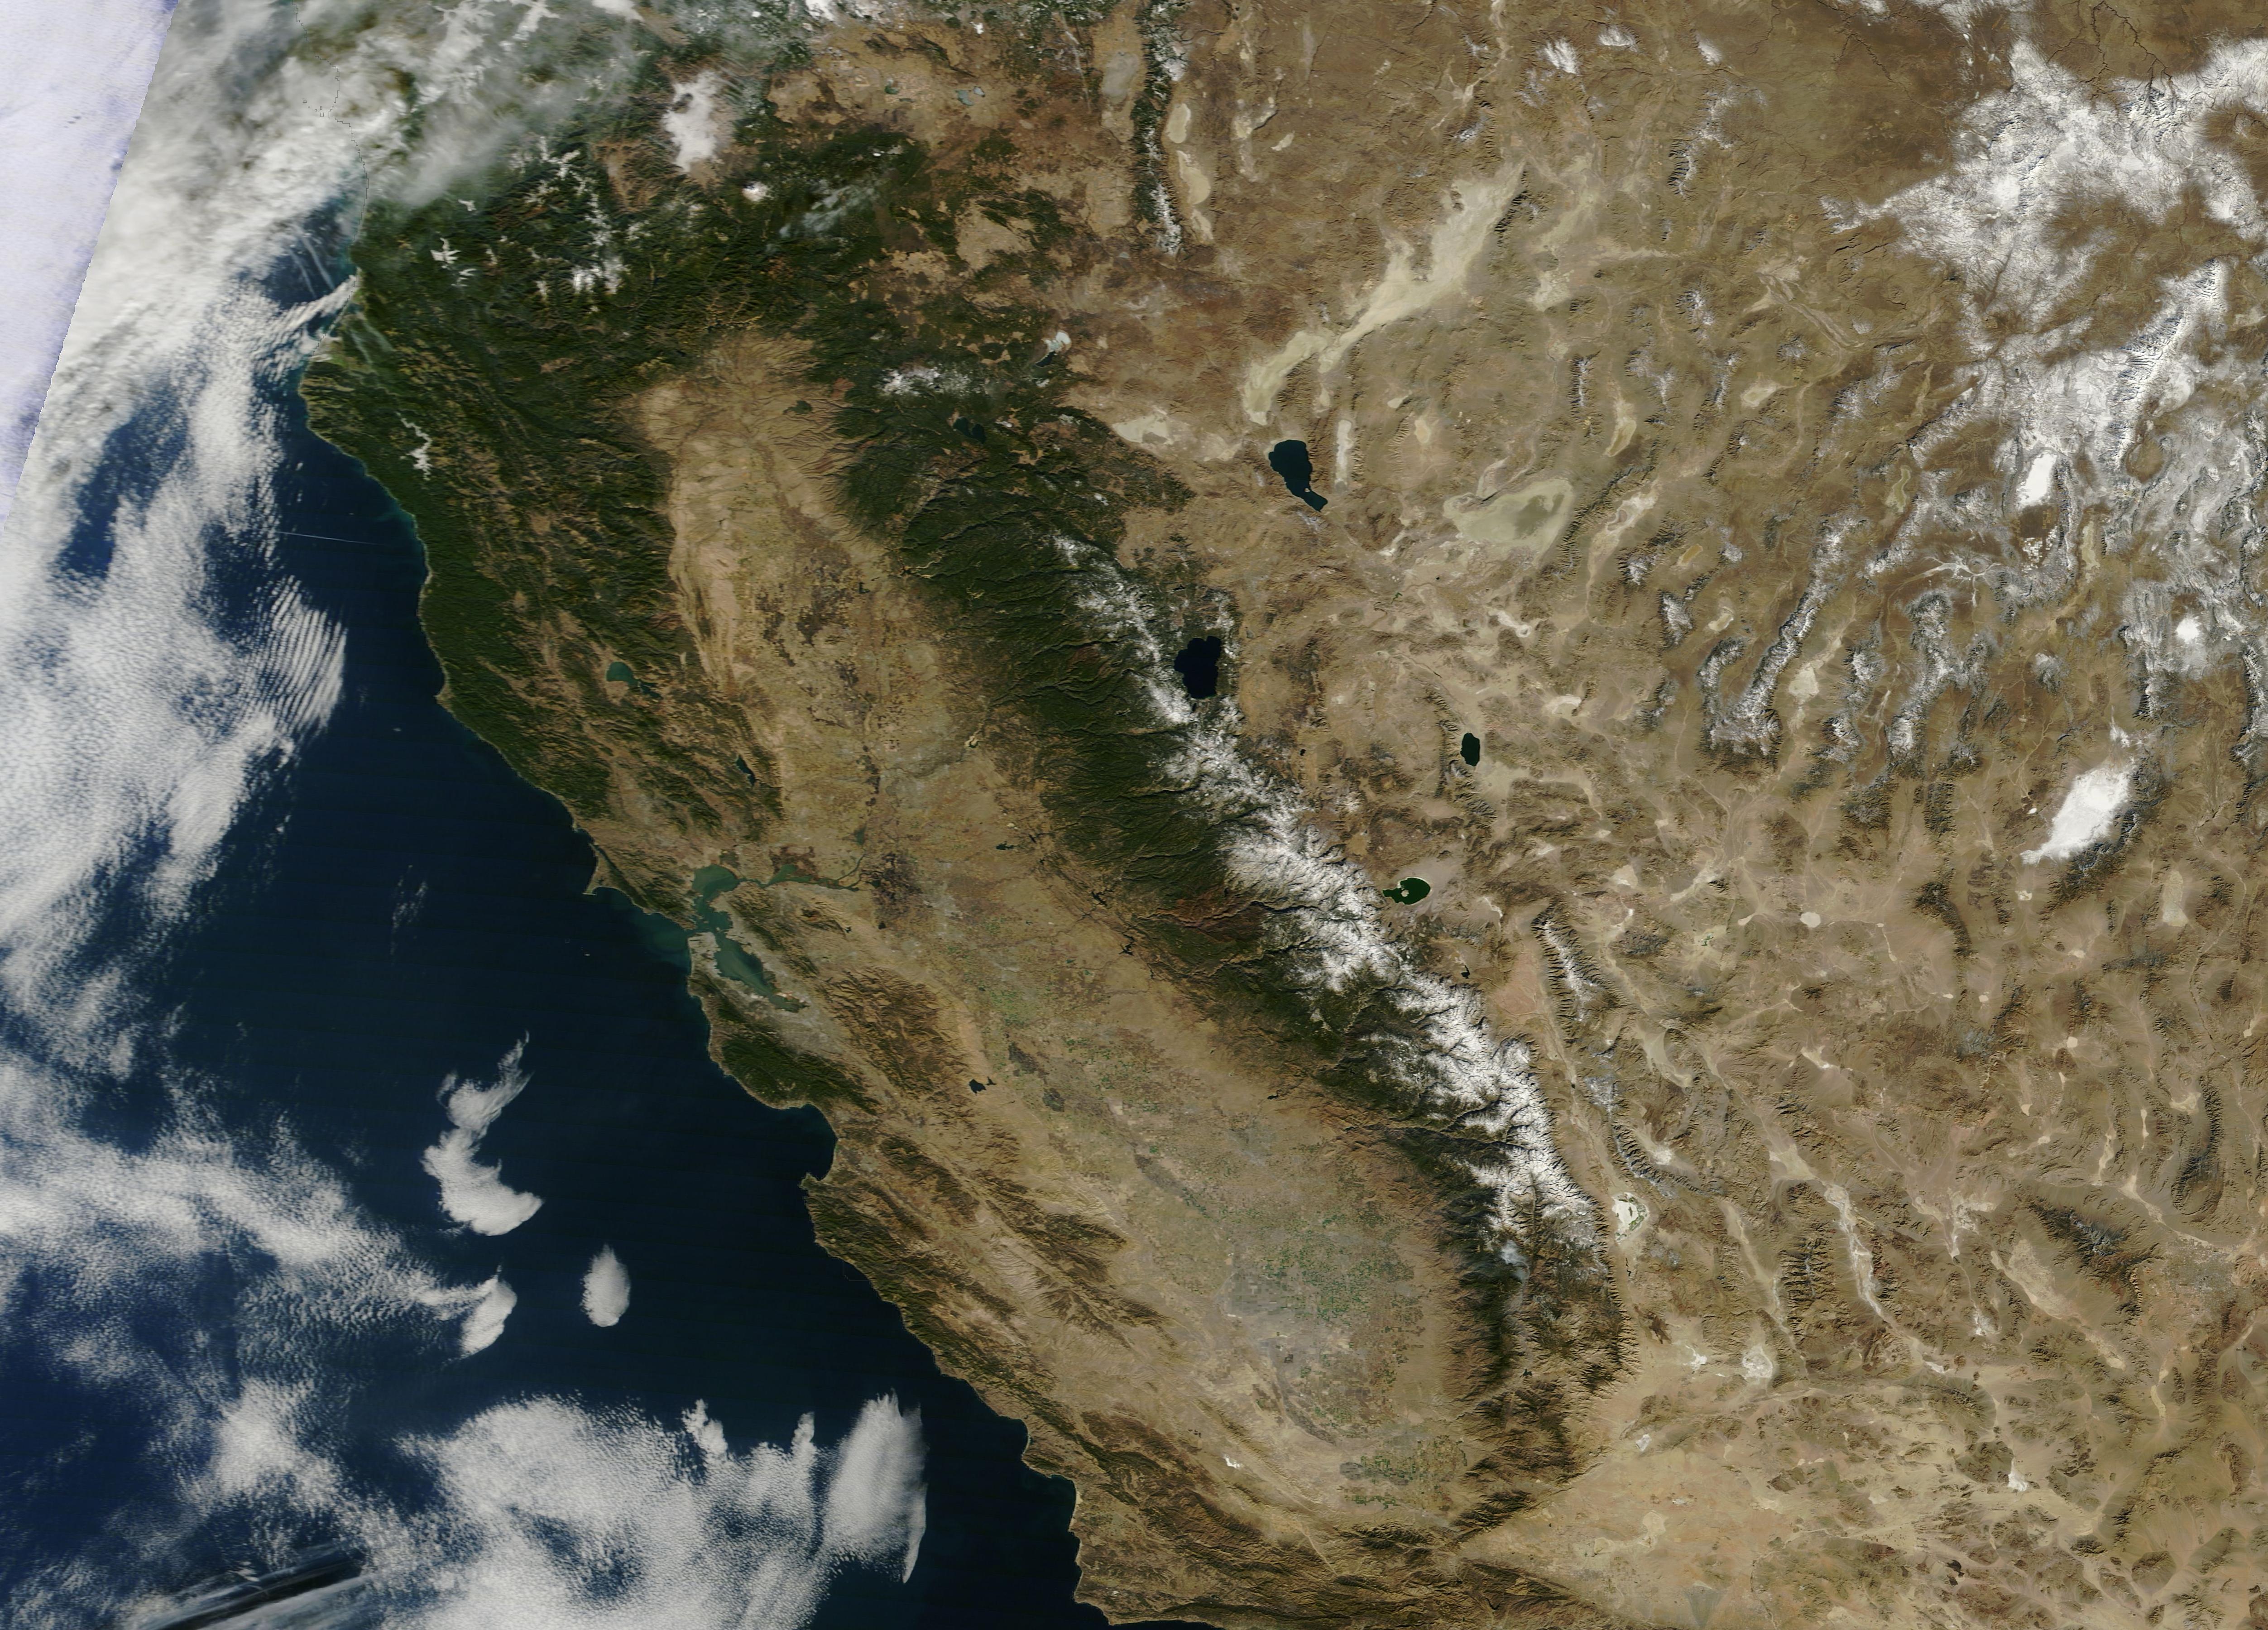
2014 MODIS image of California
Credit: NASA Earth Observatory
Earth Observing-1 satellite image of the Okavango Delta during a 2012 flood
Credit: NASA Earth Observatory
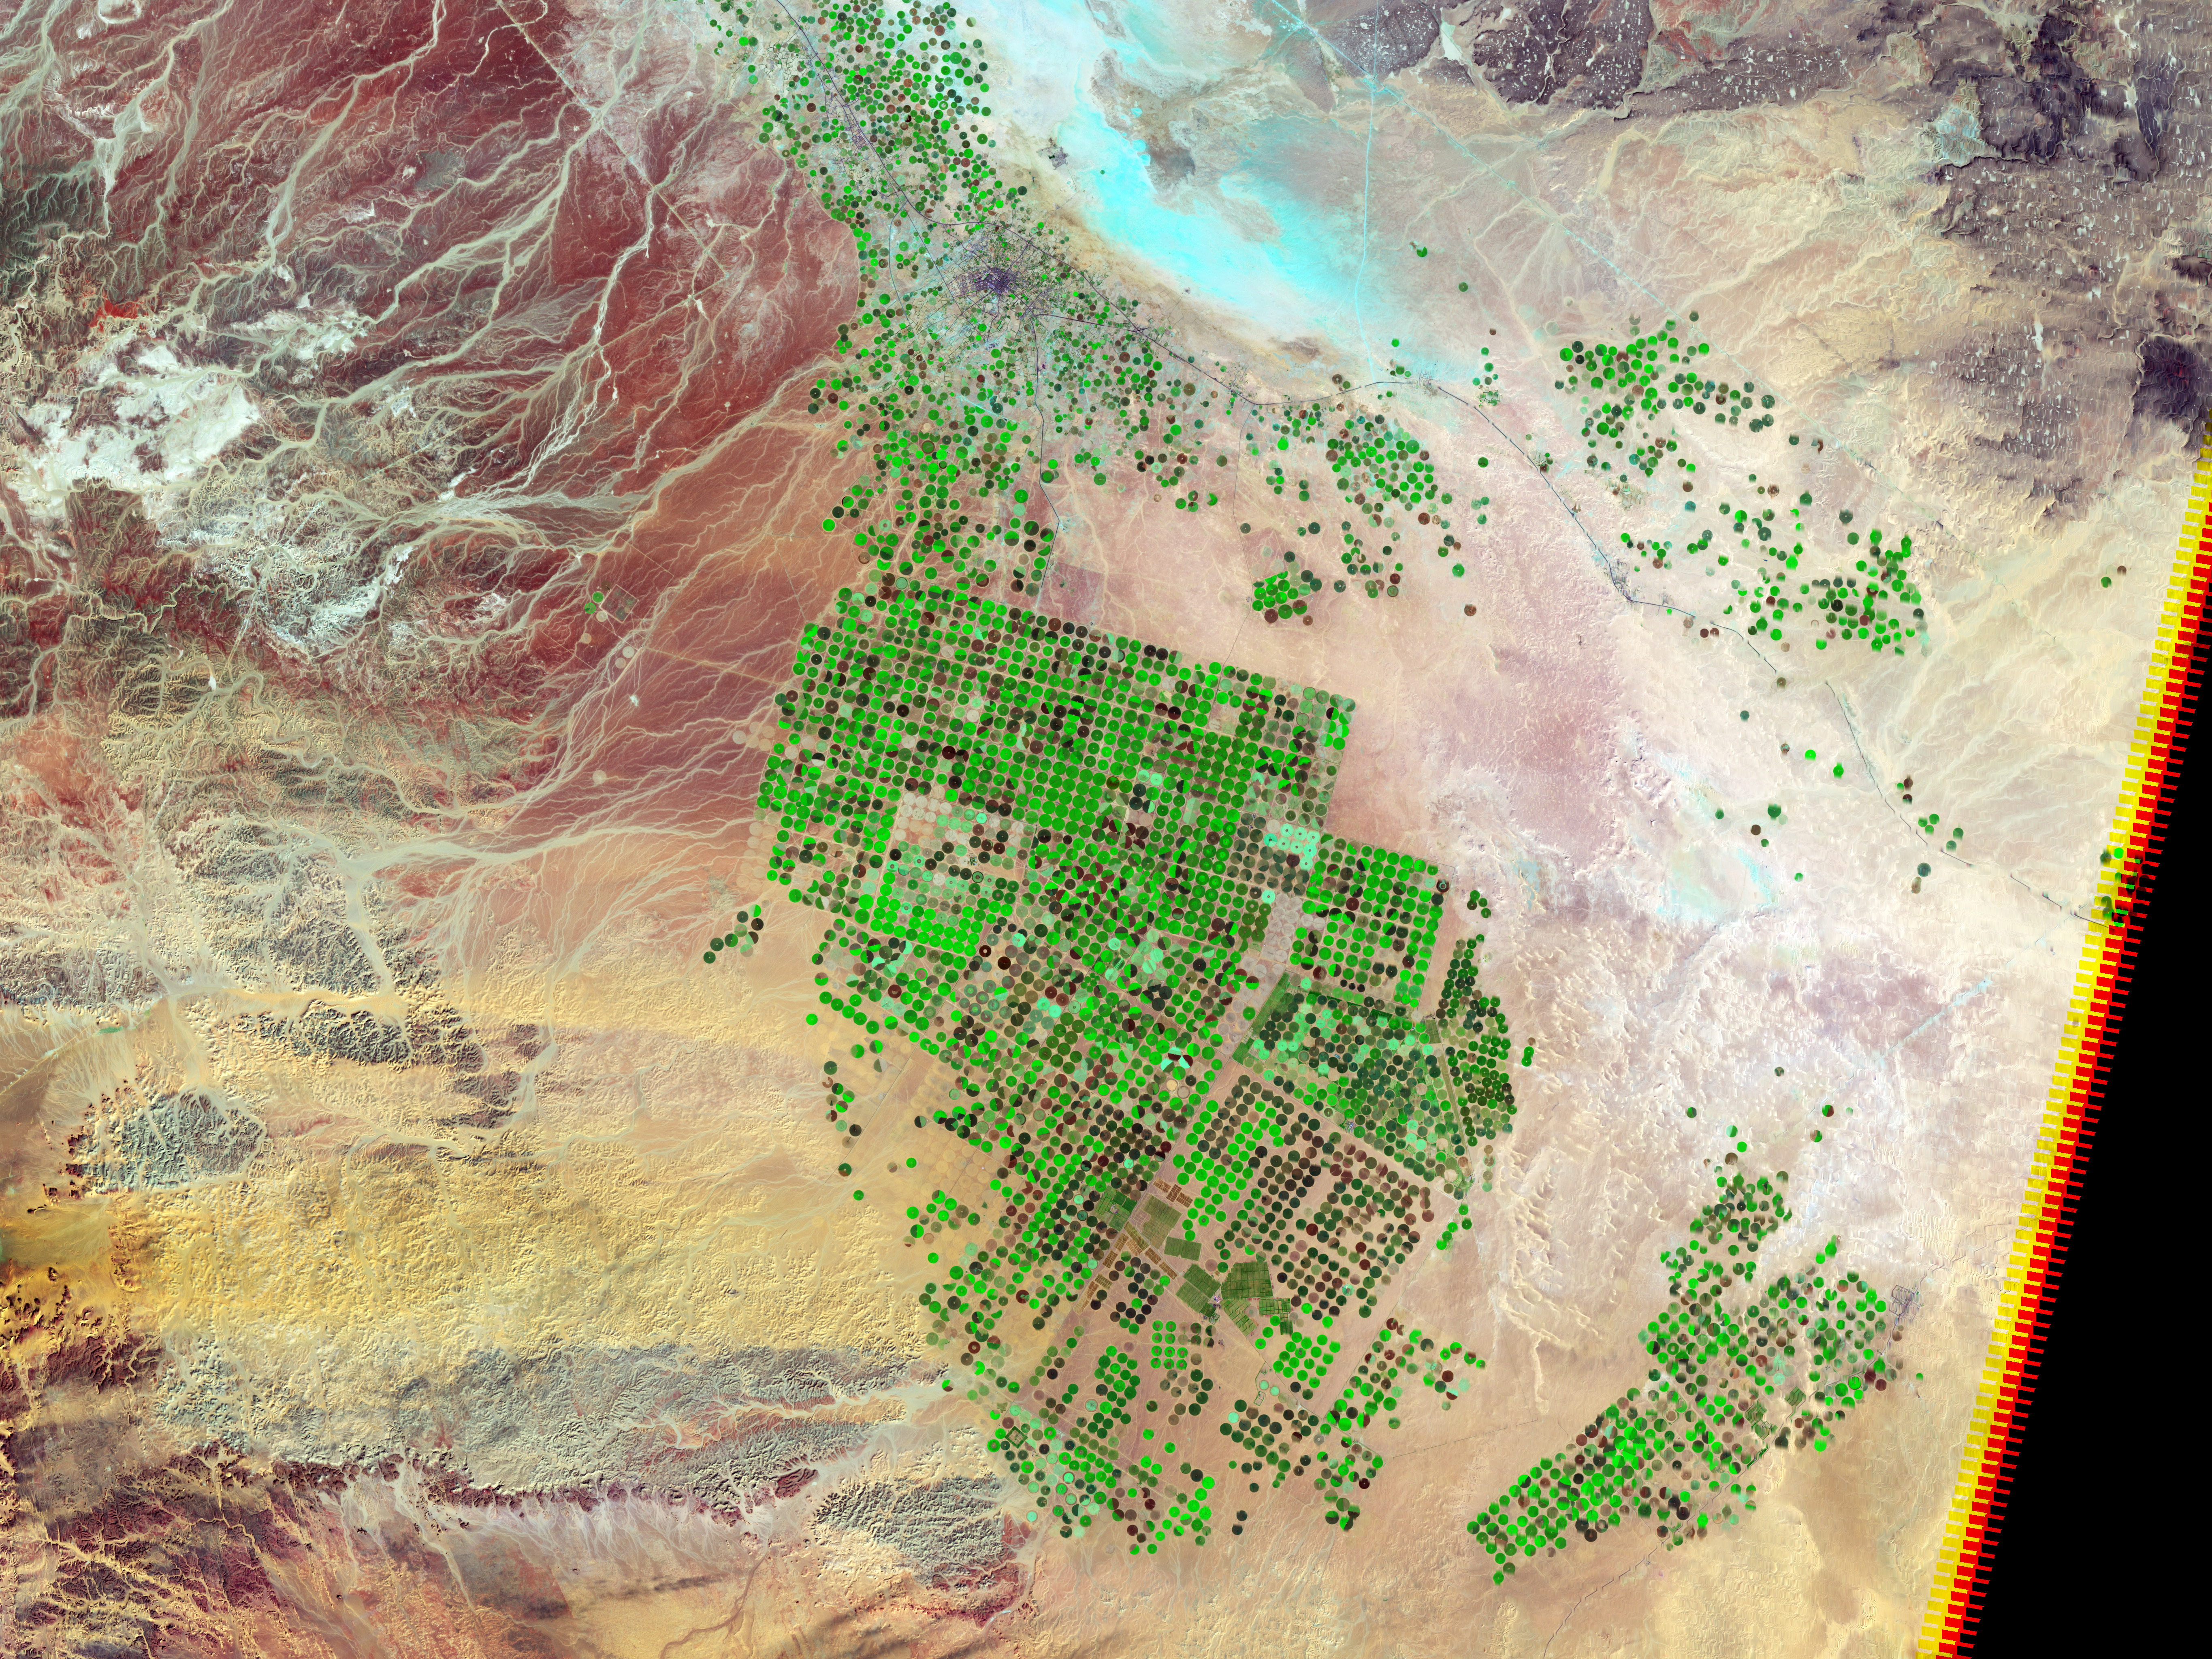
2012 Landsat image of Saudi Arabia cropland
Credit: USGS/NASA
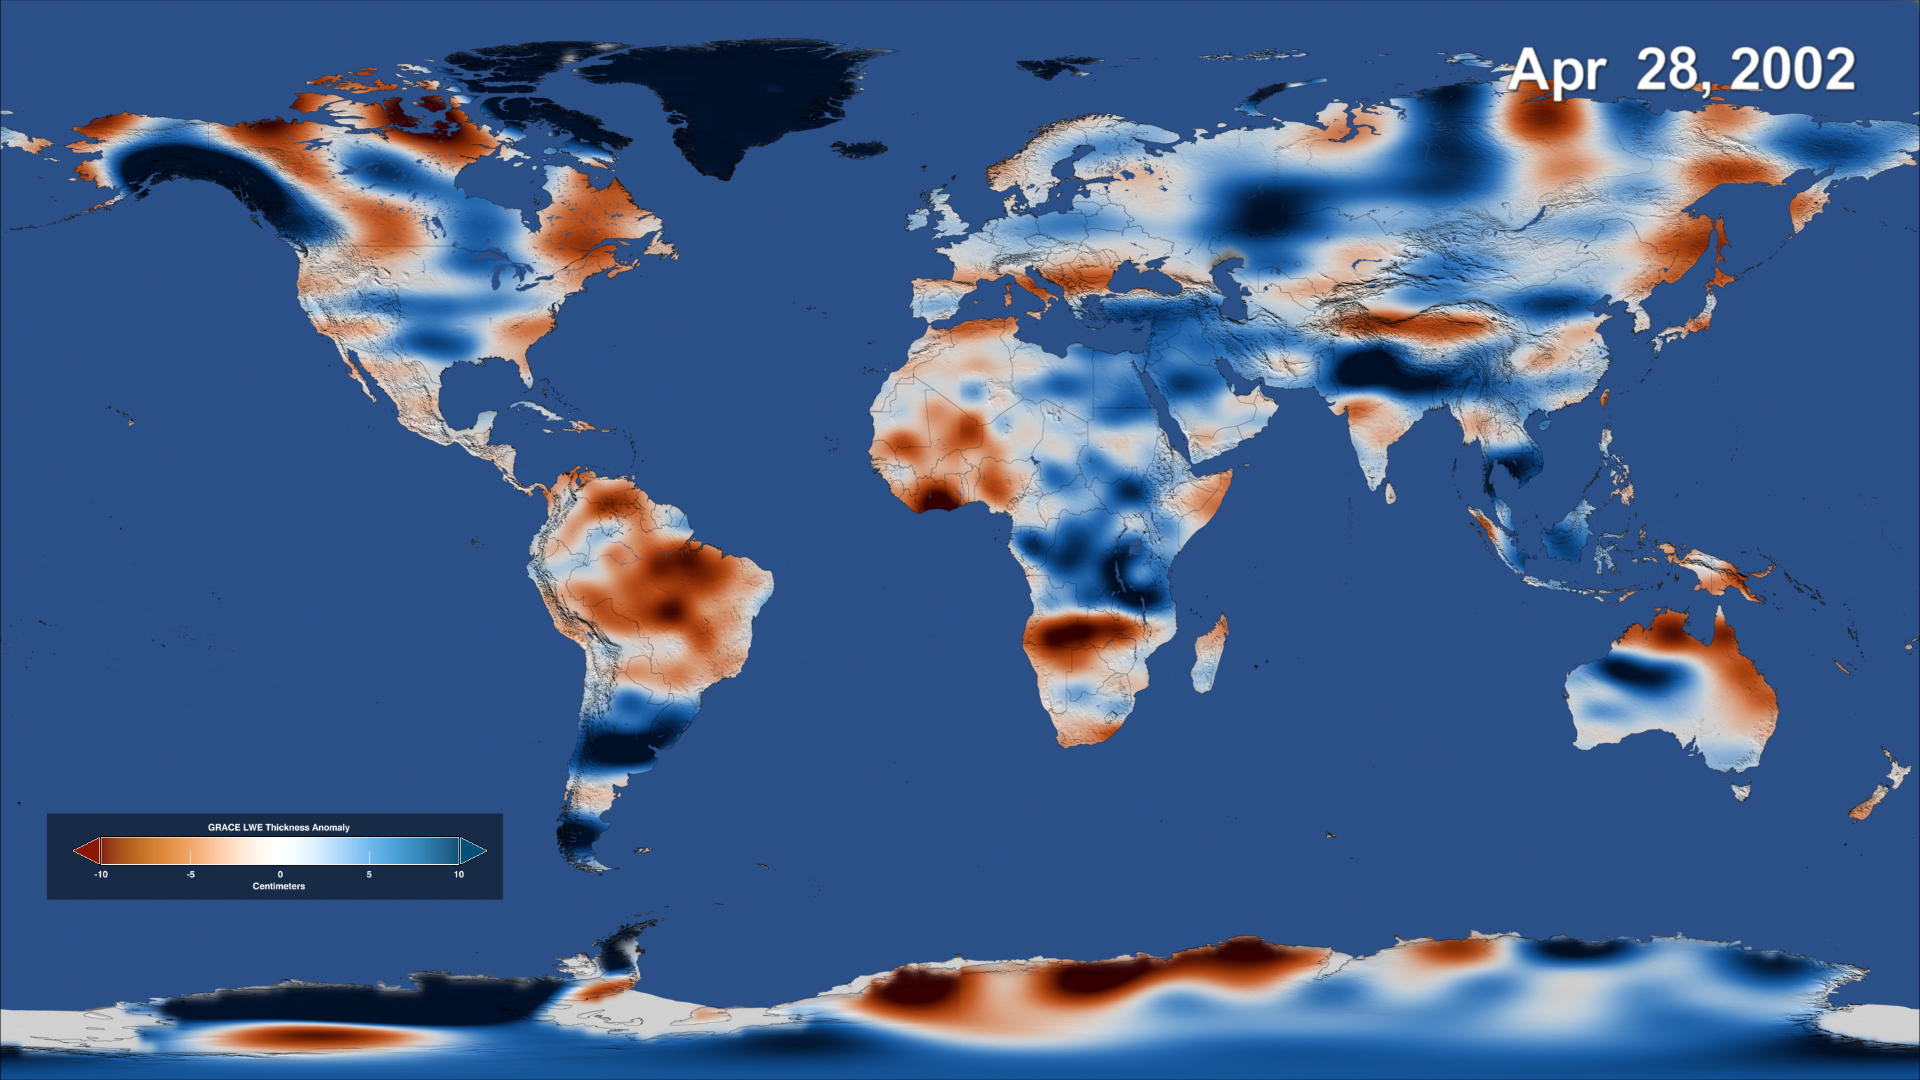
Freshwater anomalies in 2012, at the beginning of the GRACE mission, with increases above average in blue and decreases below average in red.
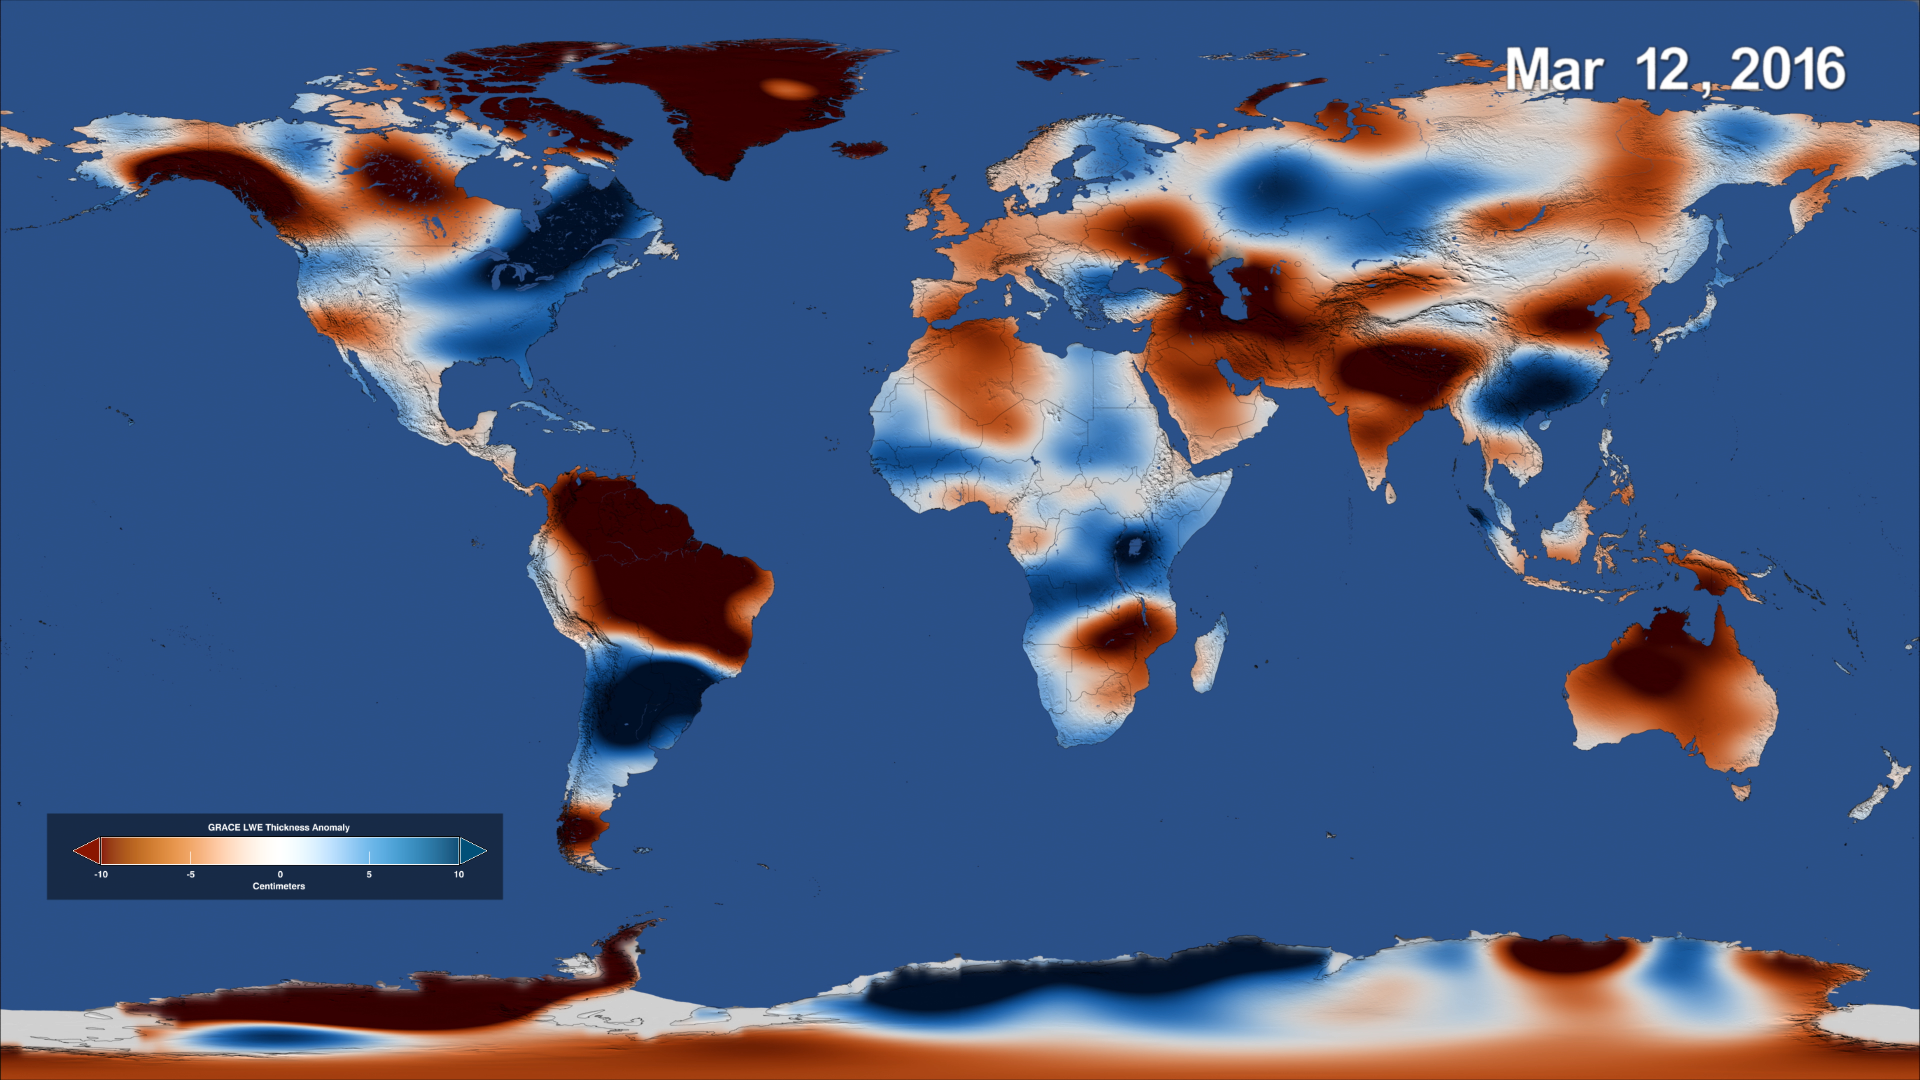
Freshwater anomalies in 2016, near the end of the GRACE mission, with increases above average in blue and decreases below average in red.
Credits
Please give credit for this item to:
NASA's Goddard Space Flight Center
-
Producer
- Kathryn Mersmann (USRA)
-
Writer
- Ellen T. Gray (ADNET Systems, Inc.)
-
Visualizer
- Trent L. Schindler (USRA)
-
Scientist
- Matthew Rodell (NASA/GSFC)
Release date
This page was originally published on Wednesday, May 16, 2018.
This page was last updated on Wednesday, May 3, 2023 at 1:46 PM EDT.
Series
This visualization can be found in the following series:Sources
- ID: 4627
 Visualization
Used as a Source In
- ID: 4920
 Visualization
 - ID: 12950
 Produced Video