X-ray Echoes Map a 'Killer' Black Hole
NASA Goddard astronomer Erin Kara discusses the discovery of X-ray echoes from Swift J1644+57, a black hole that shattered a passing star. X-rays produced by flares near this million-solar-mass black hole bounced off the nascent accretion disk and revealed its structure.
Credit: NASA's Goddard Space Flight Center
Music: "The Orion Arm" and "Particle Acceleration" both from Killer Tracks.
Watch this video on the NASA Goddard YouTube channel.
Complete transcript available.
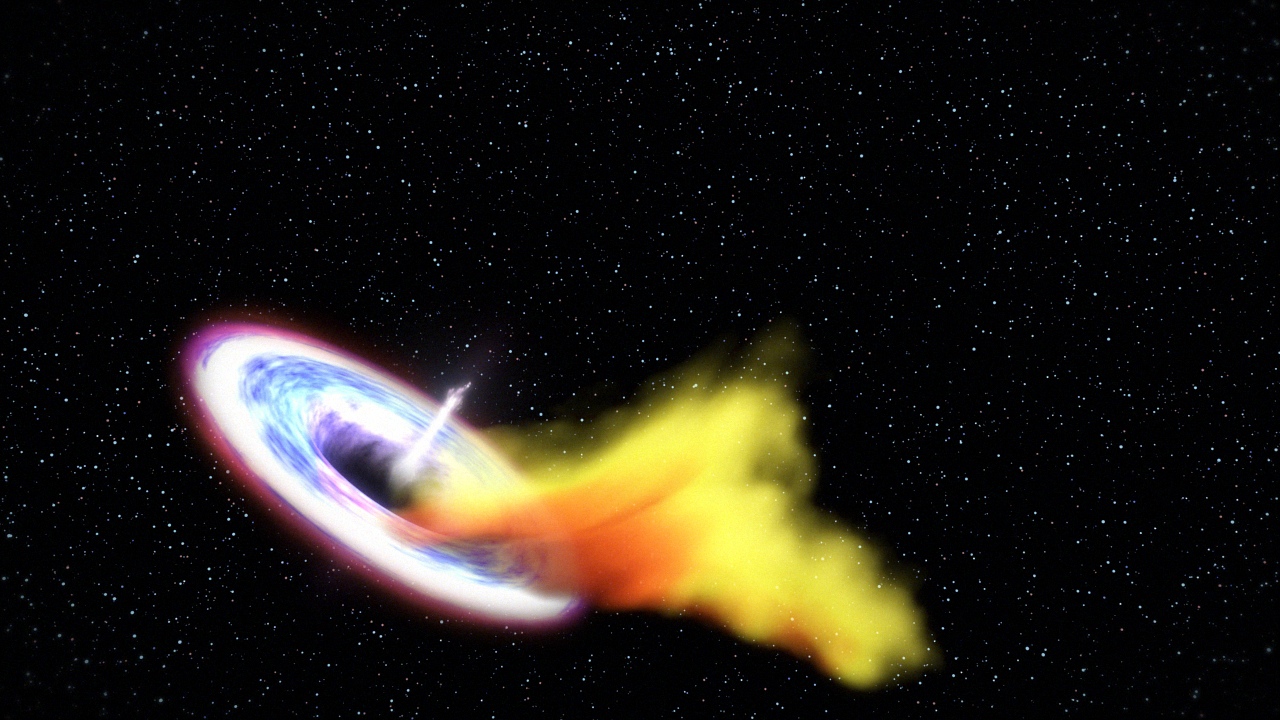
Some 3.9 billion years ago in the heart of a distant galaxy, the tidal pull of a monster black hole shredded a star that wanderd too close. X-rays produced in this event first reached Earth on March 28, 2011, when they were detected by NASA's Swift satellite. Within days, scientists concluded that the outburst, now known as Swift J1644+57, represented both the tidal disruption of a star and the sudden flare-up of a previously inactive black hole.
Now astronomers using archival observations from Swift, the European Space Agency's XMM-Newton observatory and the Japan-led Suzaku satellite have identified the reflections of X-ray flares erupting during the event. Led by Erin Kara, a postdoctoral researcher at NASA's Goddard Space Flight Center in Greenbelt, Maryland, and the University of Maryland, College Park, the team has used these light echoes, or reverberations, to map the flow of gas near a newly awakened black hole for the first time.
Swift J1644+57 is one of only three tidal disruptions that have produced high-energy X-rays, and to date it remains the only event caught at the peak of this emission. While astronomers don't yet understand what causes flares near the black hole, when one occurs they can detect its echo a couple of minutes later as its light washes over structures in the developing accretion disk. The technique, called X-ray reverberation mapping, has been used before to explore stable disks around black holes, but this is time it has been applied to a newly formed disk produced by a tidal disruption.
Swift J1644+57's accretion disk was thicker, more turbulent and more chaotic than stable disks, which have had time to settle down into an orderly routine. One surprise is that high-energy X-rays arise from the innermost regions of the disk instead of a narrow jet of accelerated particles, as originally thought.
The researchers estimate the black hole has a mass about a million times that of the sun. They expect future improvements in understanding and modeling accretion flows will allow them to measure the black hole's spin using this data.

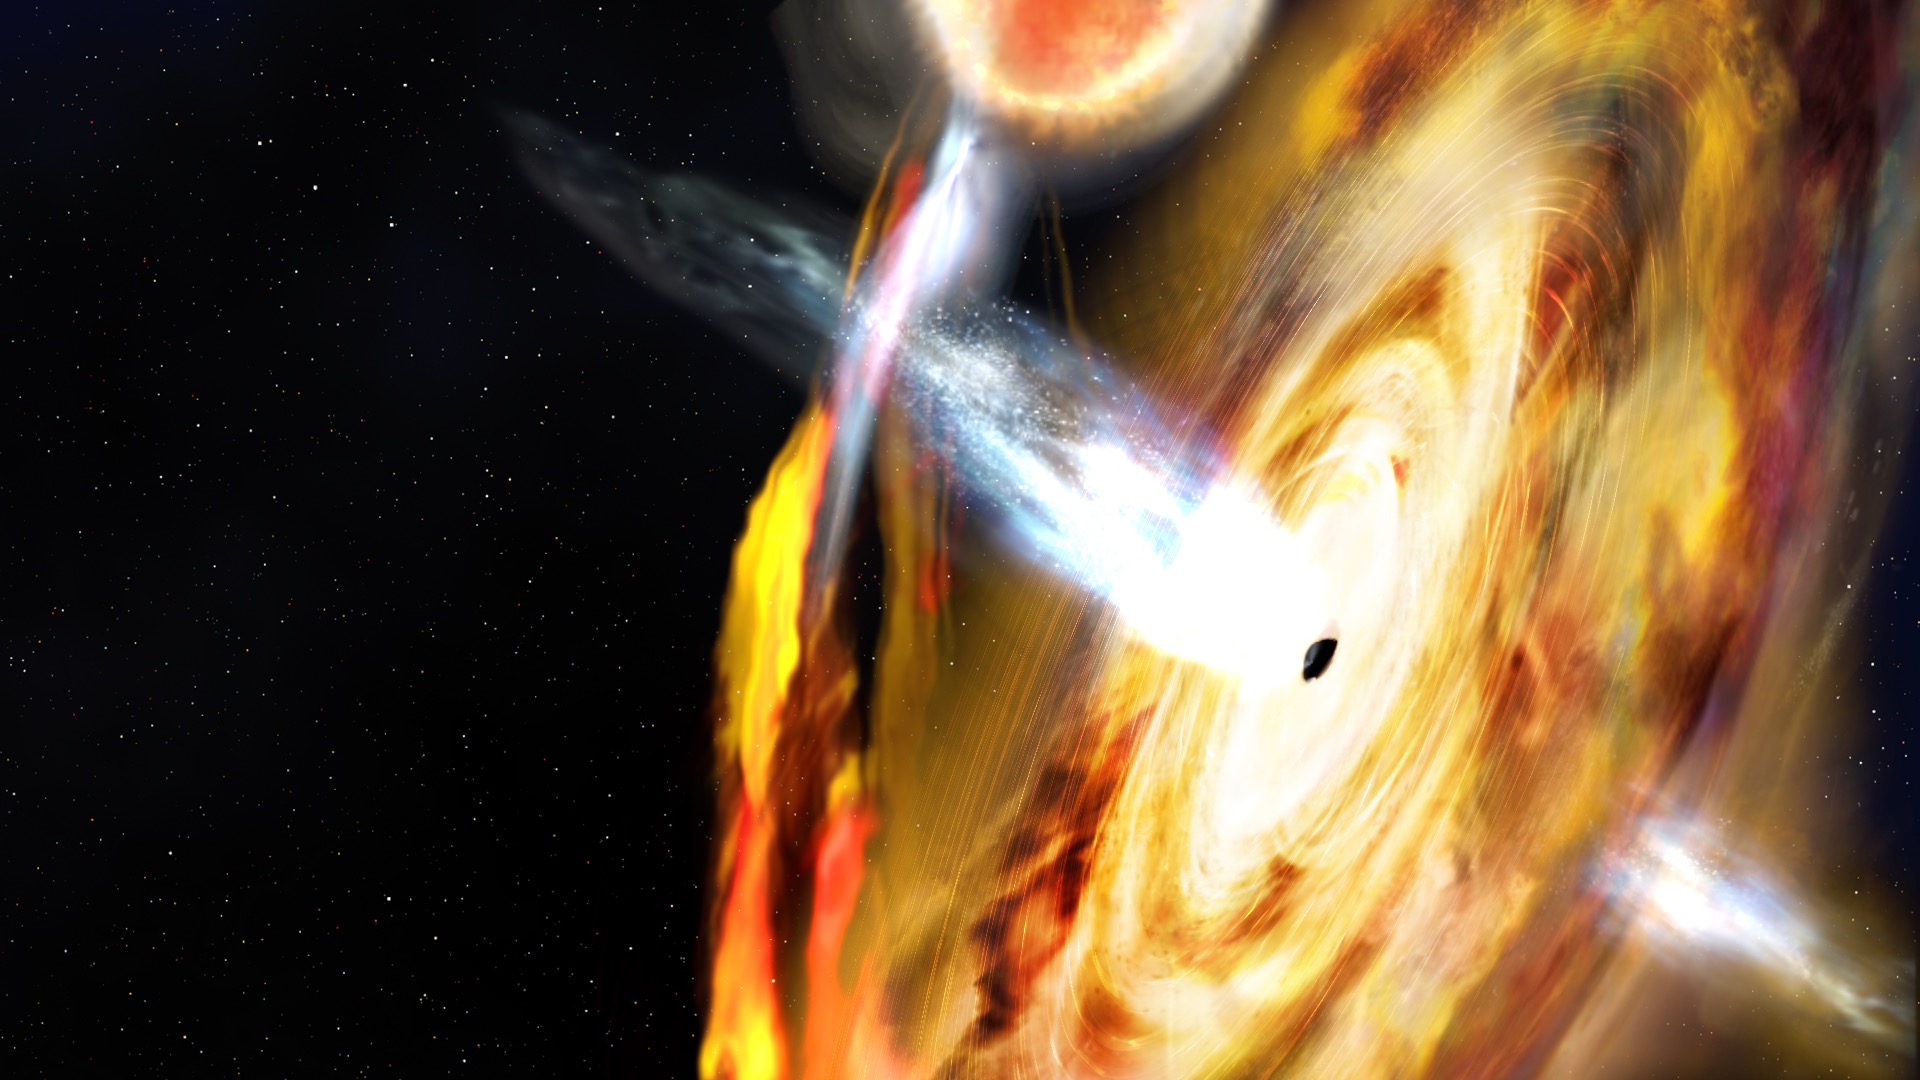
In this artist's rendering, a thick accretion disk has formed around a supermassive black hole following the tidal disruption of a star that wandered too close. Stellar debris has fallen toward the black hole and collected into a thick chaotic disk of hot gas. Flashes of X-ray light near the center of the disk result in light echoes that allow astronomers to map the structure of the funnel-like flow, revealing for the first time strong gravity effects around a normally quiescent black hole. Includes animated gif.
Credit: NASA/Swift/Aurore Simonnet, Sonoma State Univ.
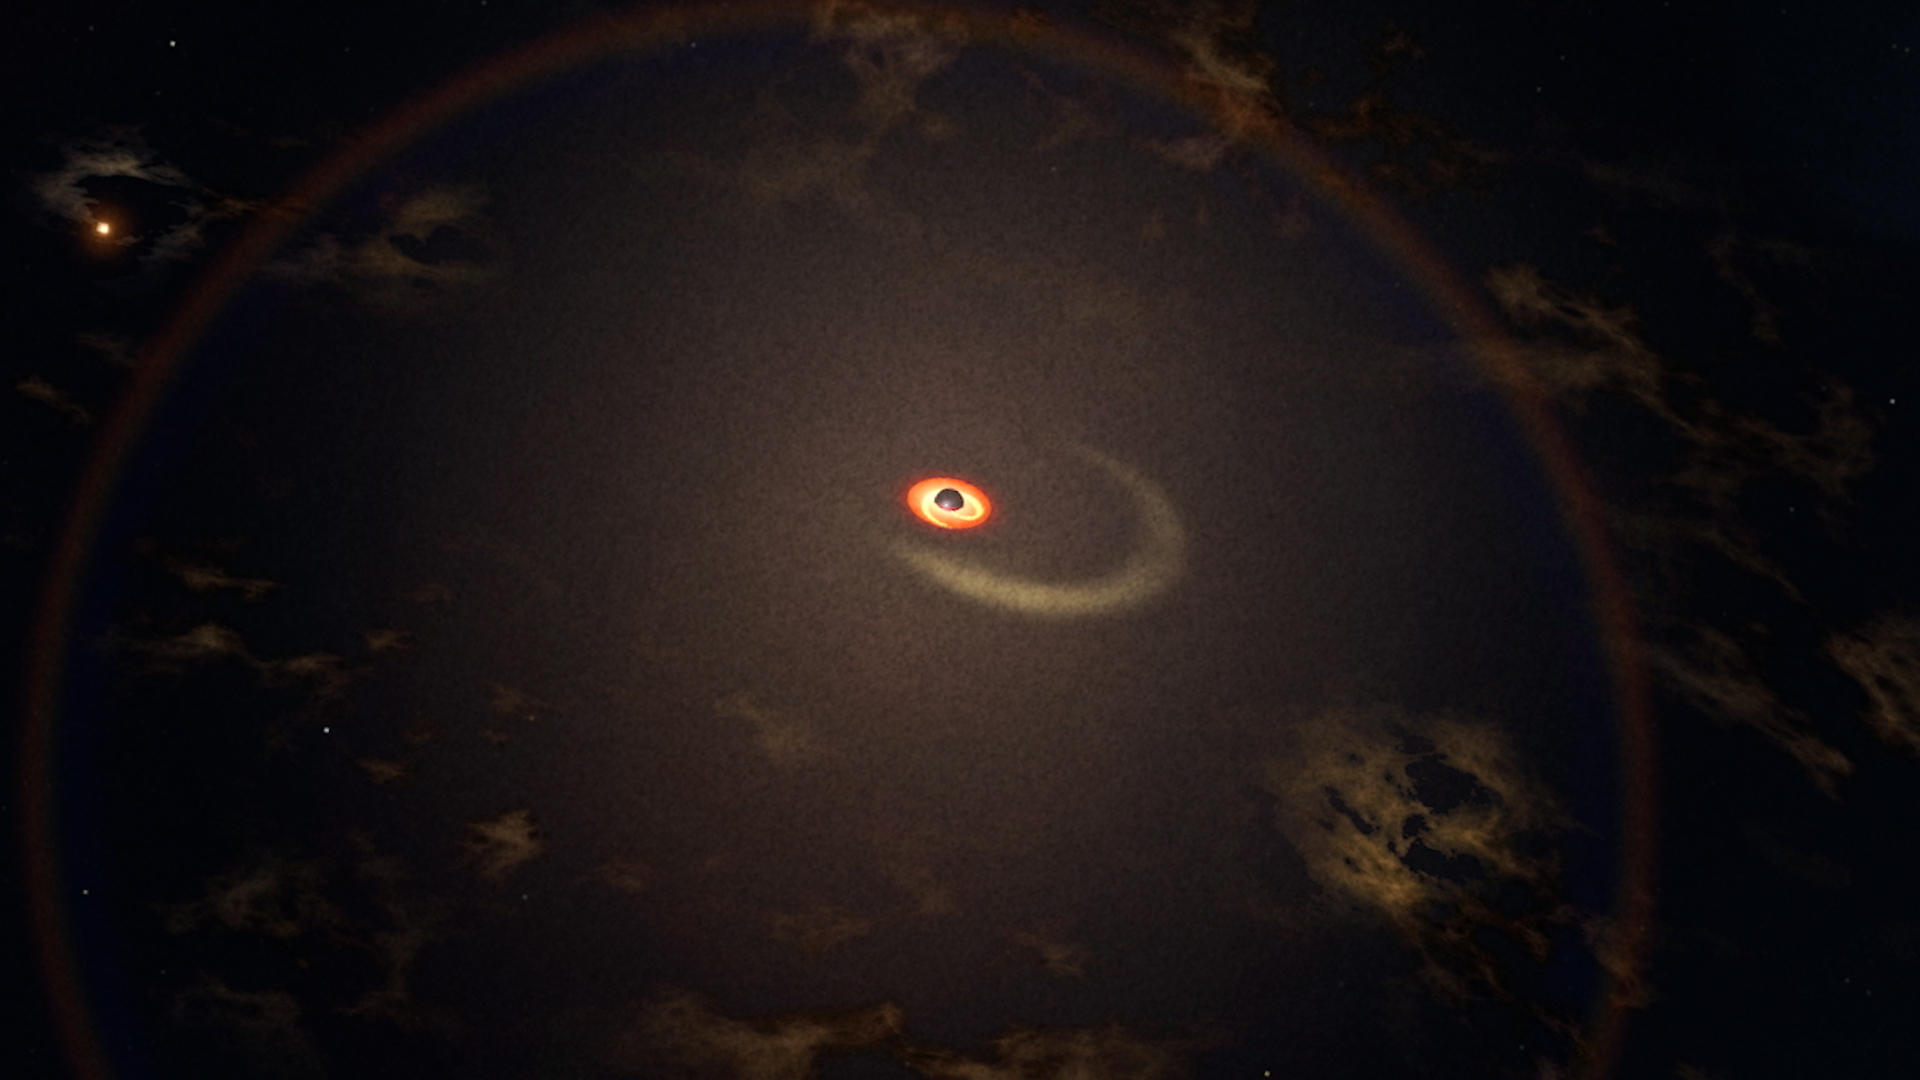
This simulation by Hotaka Shiokawa and his colleagues follows the formation of an accretion disk around a modest black hole with about 500 times the sun's mass after tidal forces have disrupted a white dwarf star with about 64 percent of the sun's mass. Many features seen in the simulation scale up to more massive black holes and stars. The movie opens as the first gas streams from the shattered star swing around the black hole. Before they can form a stable accretion disk, the stellar debris must lose kinetic energy. This is accomplished through the formation of standing shock waves (lighter colors) enhanced by the effects of general relativity.
Credit: H. Shiokawa et al. 2015
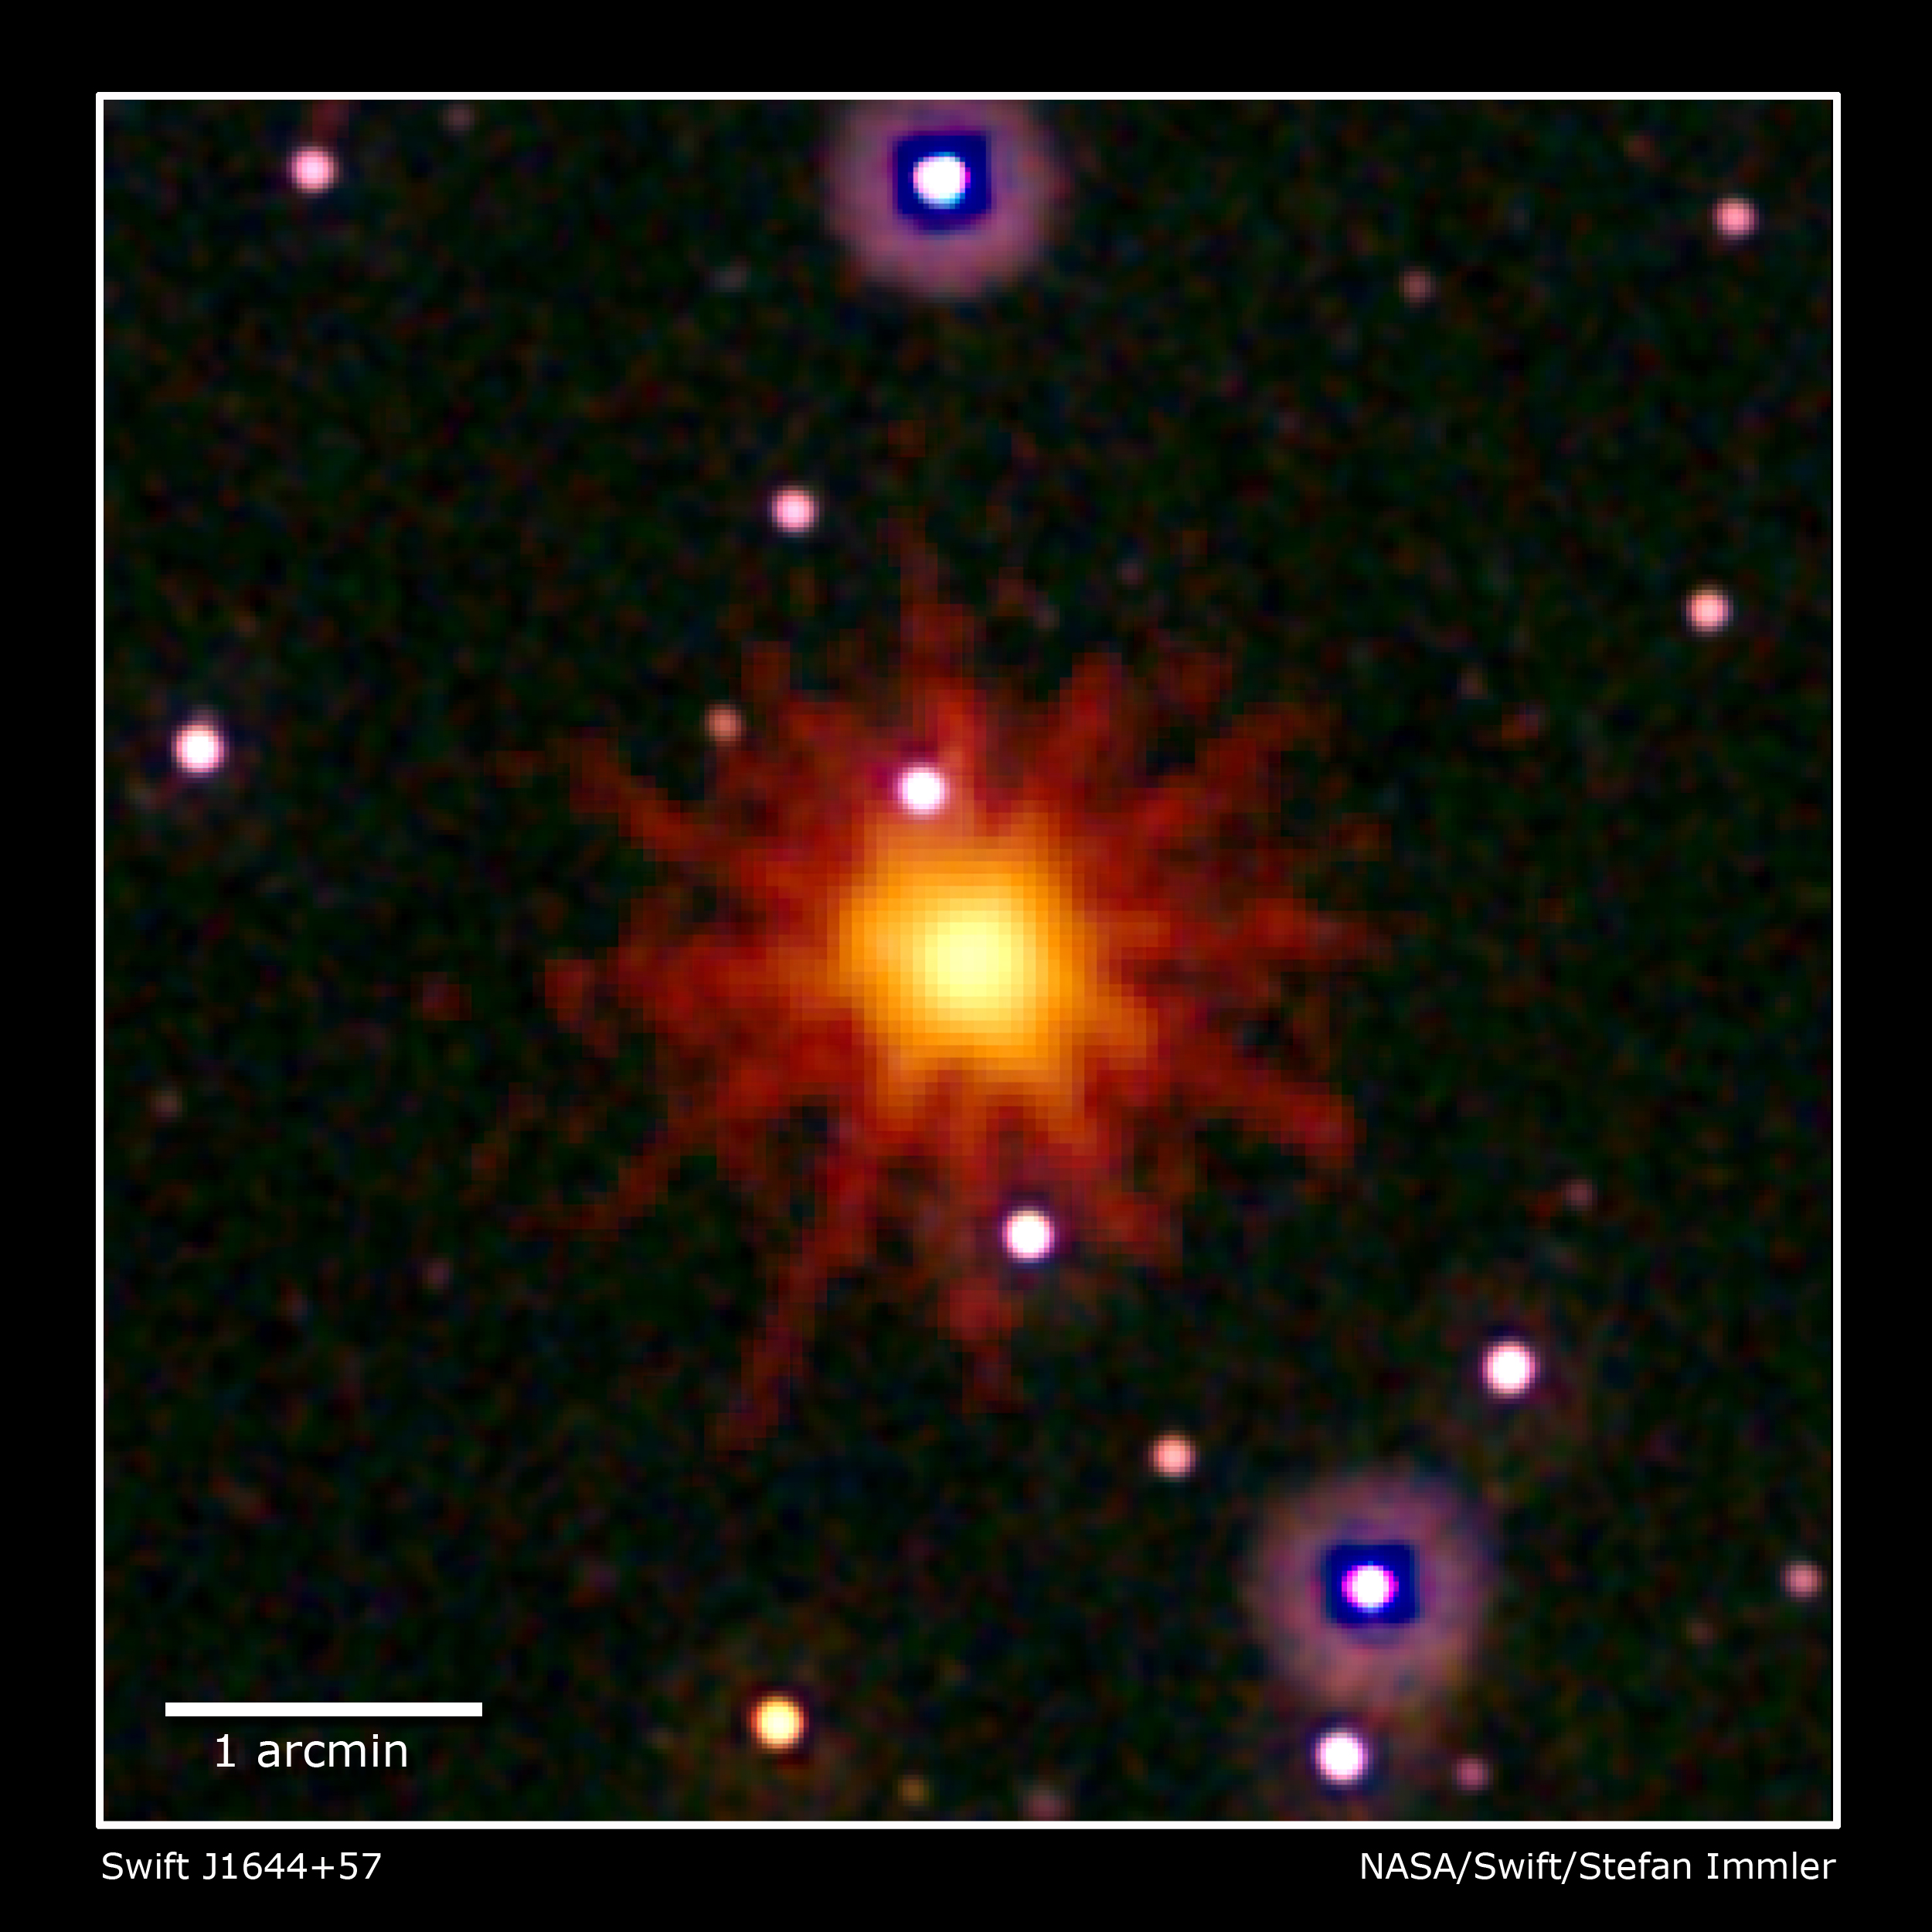
Images from Swift's Ultraviolet/Optical (white, purple) and X-Ray telescopes (yellow and red) were combined in this composite of Swift J1644+57, an X-ray outburst astronomers classify as a tidal disruption event. The event is seen only in the X-ray image, which is a 3.4-hour exposure taken on March 28, 2011. The outburst was triggered when a passing star came too close to a supermassive black hole. The star was torn apart, and much of the gas fell toward the black hole. To date, this is the only tidal disruption event emitting high-energy X-rays that astronomers have caught at peak luminosity.
Credit: NASA/Swift/Stefan Immler

Same as above without label.Credit: NASA/Swift/Stefan Immler
X-rays from flares near the black hole reflect off gas in the surrounding accretion disk. When this light reaches the gas, it excites iron ions and causes them to fluoresce. This creates an X-ray echo that follows with a time delay depending on its distance from the source. Using this information, astronomers can explore the structure of the inner accretion disk and determine properties of the black hole. Includes animated gif.
Credit: NASA's Goddard Space Flight Center
For More Information
Credits
Please give credit for this item to:
NASA's Goddard Space Flight Center. However, individual items should be credited as indicated above.
-
Producer
- Scott Wiessinger (USRA)
-
Science writer
- Francis Reddy (Syneren Technologies)
-
Scientist
- Erin Kara (UMD)
-
Interviewee
- Erin Kara (UMD)
-
Editor
- Scott Wiessinger (USRA)
-
Narrator
- Scott Wiessinger (USRA)
-
Animators
- Scott Wiessinger (USRA)
- Ryan Zuber (UMBC)
- Brian Monroe (USRA)
-
Technical support
- Aaron E. Lepsch (ADNET Systems, Inc.)
-
Visualizer
- Jeremy Schnittman (NASA/GSFC)
Release date
This page was originally published on Wednesday, June 22, 2016.
This page was last updated on Wednesday, May 3, 2023 at 1:48 PM EDT.
Missions
This visualization is related to the following missions:Series
This visualization can be found in the following series:Papers used in this visualization
Related
- ID: 14408
 Produced Video
 - ID: 12854
 Produced Video
 - ID: 10807
 Produced Video