Dating Ice

Scientists create a 3-D map showing the age of the Greenland ice sheet.
Greenland is the second largest mass of ice on Earth, containing enough water to raise ocean levels by about 20 feet. The ice sheet has been losing mass over the past two decades and warming temperatures will mean more losses in the future. Since 2009, a NASA airborne mission called Operation IceBridge has surveyed Greenland using a variety of instruments including radar and laser altimeters to measure the internal layering of its ice and changes to the ice sheet’s thickness. Now, the radar data has been combined with observations from ground-based surveys and earlier airborne missions to create the first comprehensive map of layers deep inside the ice sheet. The map reveals how the ice sheet’s layers formed in response to periods of climate change dating back to more than a hundred thousand years ago when temperatures were roughly as warm as today. Scientists will use the information to help evaluate models that project Greenland’s future contribution to sea-level rise. Watch the video to learn more.
Greenland is covered in ice up to two miles thick. Explore a 3-D map of its many frozen layers in this video.
Greenland's ice sheet is made up of layers of snow that accumulated and became compacted over thousands of years.
The snow forms distinct layers of ice (above) that can be detected by radar.
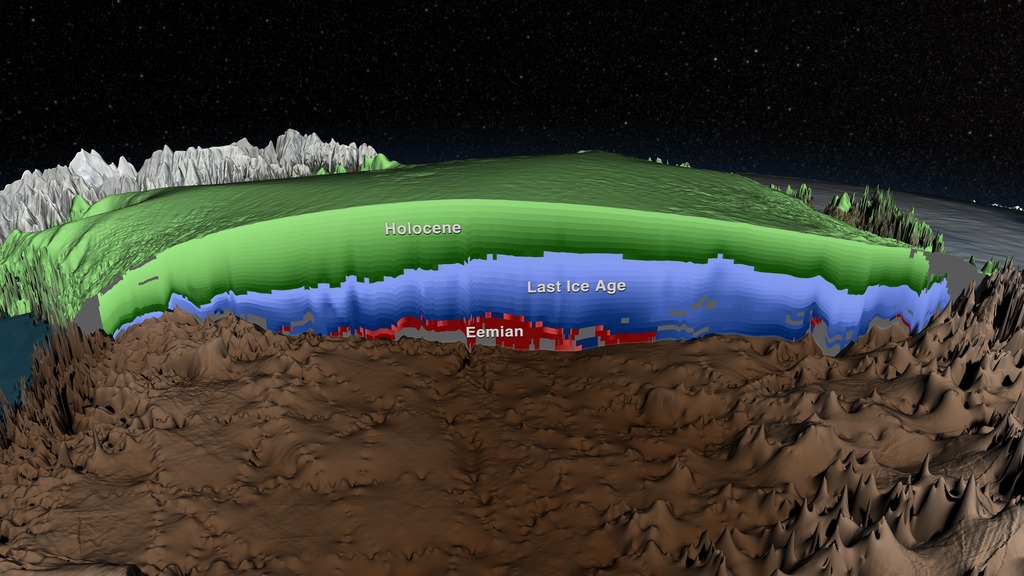
In this 3-D map created from radar data, colors represent the known age of ice layers within Greenland's ice sheet.
For More Information
See NASA.gov
Credits
Please give credit for this item to:
NASA's Scientific Visualization Studio
-
Writer
- George R. Hale (Telophase)
-
Animators
- Cindy Starr (Global Science and Technology, Inc.)
- Greg Shirah (NASA/GSFC)
-
Video editors
- Jefferson Beck (USRA)
- Cindy Starr (Global Science and Technology, Inc.)
- Stuart A. Snodgrass (HTSI)
-
Narration
- Joe MacGregor (University of Texas)
- Jefferson Beck (USRA)
- Mark Fahnestock (University of Alaska)
- Cindy Starr (Global Science and Technology, Inc.)
-
Narrator
- Jefferson Beck (USRA)
-
Producer
- Jefferson Beck (USRA)
-
Scientists
- Joe MacGregor (University of Texas)
- Mark Fahnestock (University of Alaska)
Release date
This page was originally published on Tuesday, February 3, 2015.
This page was last updated on Wednesday, May 3, 2023 at 1:50 PM EDT.
Related
- ID: 4249
 Visualization