The HoloGlobe Project (Version 2)
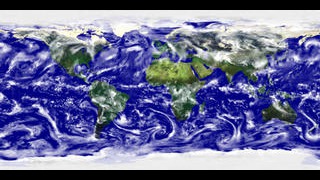
This animation was produced for the Smithsonian Institution's HoloGlobe Exhibit which opened to the public on August 10, 1996. The various orthographic data sets showing progressive global change were mapped onto a rotating globe and projected into space to create a holographic image of the Earth. Showing Earthandapos;s atmosphere, hydrosphere, geosphere, and biosphere are dynamic, changing on timescales of days, minutes, or even seconds. This animation is a revised version of Animation #96 [The HoloGlobe Project (Version 1)].
Narrated Hologlobe (version 2)
Credits
Please give credit for this item to:
NASA/Goddard Space Flight Center -
Scientific Visualization Studio,
Smithsonian Institution,
National Science Foundation (NSF),
Defense Advanced Research Projects Agency (DARPA),
Global Change Research Project (GCRP),
National Oceanic and Atmosphere Administration (NOAA),
Dimensional Media Associates (DMA),
New York Film and Animation Company,
Silicon Graphics, Inc. (SGI),
Hughes STX Corporation
-
Animators
- Horace Mitchell (NASA/GSFC)
- Andy Acuna (Hughes STX)
- John Cavallo (Hughes STX)
- Liam Krauss (Hughes STX)
- Jim Strong (NASA/GSFC)
- Barbara Summey (Raytheon)
- Brian Tighe (NASA)
- Marit Jentoft-Nilsen (RSIS)
- Kannappan Palaniappan (NASA/GSFC)
-
Narrator
-
Scientists
- Jim Strong (NASA/GSFC)
- Fritz Hasler (NASA/GSFC)
- Horace Mitchell (NASA/GSFC)
- Tom Watters (Smithsonian/Air and Space)
-
Writer
- Tom Watters (Smithsonian/Air and Space)
Release date
This page was originally published on Friday, October 25, 1996.
This page was last updated on Wednesday, May 3, 2023 at 2:00 PM EDT.
Series
This visualization can be found in the following series:Datasets used in this visualization
-
[DMSP: OLS]
ID: 12Defense Meteorological Satellite Program Operational Linescan System
See all pages that use this dataset -
[FY-2]
ID: 19 -
[GMS-5]
ID: 21 -
[GOES-8]
ID: 29 -
[GOES-9]
ID: 31 -
[Galileo: Solid-State Imaging Camera]
ID: 34 -
[Meteosat]
ID: 64 -
[TAO: TRITON]
ID: 102 -
[Viking]
ID: 130 -
[Seismic Recording Networks]
ID: 143 -
Cloud Cover [ISCCP: D2]
ID: 328 -
NDVI [NOAA: AVHRR]
ID: 426 -
Sea Surface Temperature [NOAA: AVHRR]
ID: 427 -
Sea Surface Temperature Anomaly [NOAA: AVHRR]
ID: 428 -
ETOPO5
ID: 429 -
Earthquake Activity [USGS: NEIC]
ID: 528National Earthquake Information Center
This dataset can be found at: http://neic.usgs.gov
See all pages that use this dataset
Note: While we identify the data sets used in these visualizations, we do not store any further details, nor the data sets themselves on our site.
Alternate Versions
- ID: 96
 Visualization
 - ID: 155
 Visualization