Landsat 8 Onion Skin
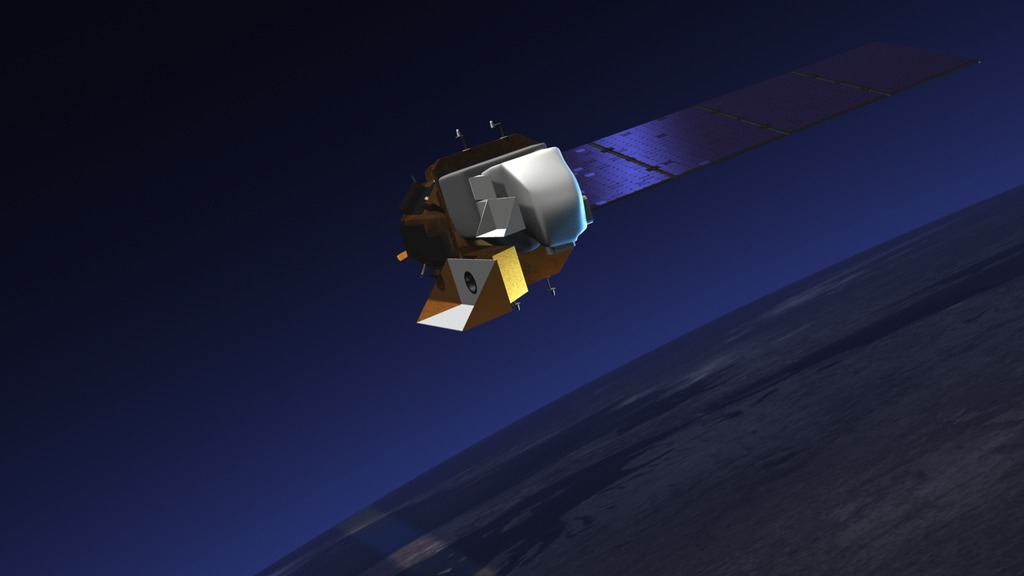
Landsat satellites circle the globe every 99 minutes, collecting data about the land surfaces passing underneath. After 16 days, the Landsat satellite has passed over every spot on the globe, and recorded data in 11 different wavelength regions. The individual wavelength bands can be combined into color images, with different combinations of the 11 bands revealing different information about the condition of the land cover.
The data for this video was collected by Landsat 5 on November 10, 2011.
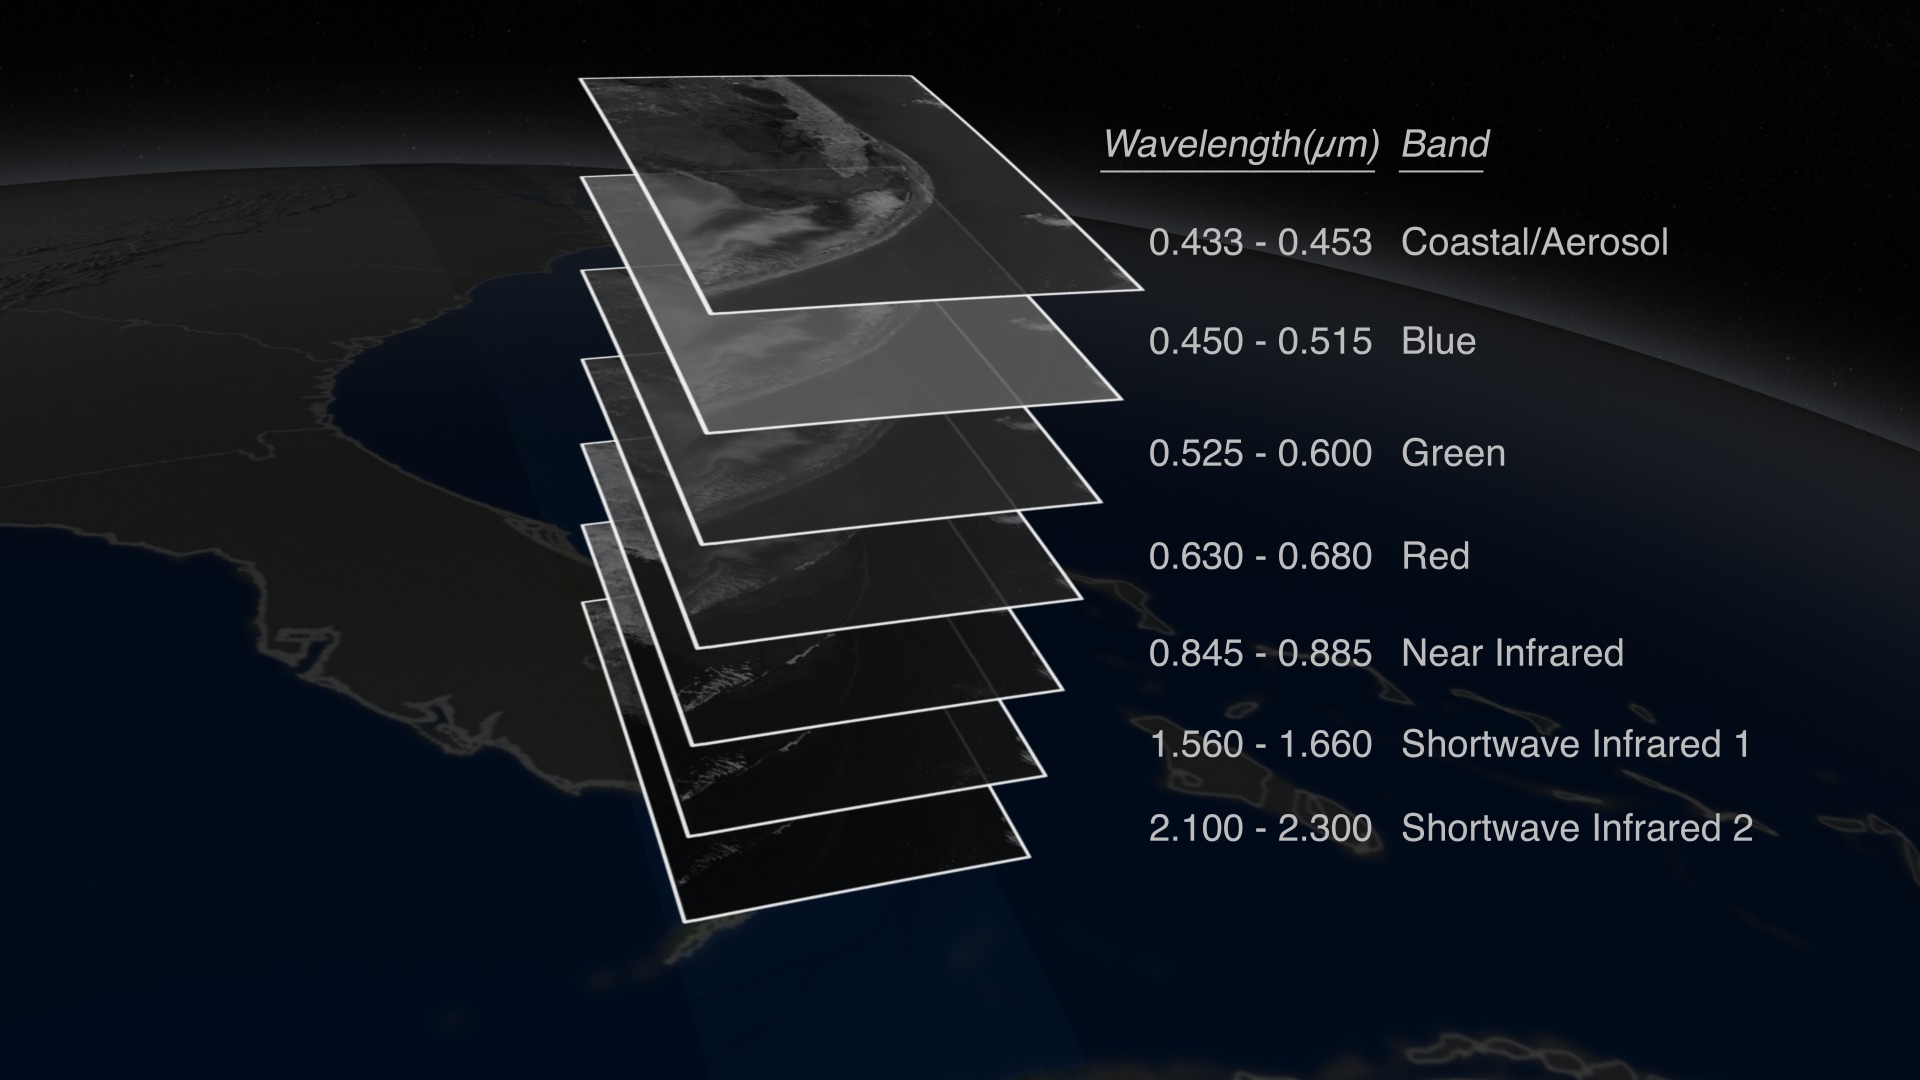
Landsat satellites circle the globe, recording data in 11 different wavelengths. The individual wavelength bands can be combined into color images, with different combinations of the 11 bands revealing different information about the condition of the land cover.
For complete transcript, click here.
Watch this video on the NASA Goddard YouTube channel.

Still image of South Florida based on Landsat data in the visible wavelengths (blue, green, and red bands). The data was collected by Landsat 5 on November 10, 2011.
Still image of South Florida based on Landsat data in the visible and near-infrared wavelengths (green, red, and near-infrared bands). The data was collected by Landsat 5 on November 10, 2011.
Still image of South Florida based on Landsat data in the visible, near-infrared, and shortwave-infrared wavelengths (green, near-IR, and shortwave-IR 2 bands). The data was collected by Landsat 5 on November 10, 2011.
Credits
Please give credit for this item to:
NASA's Goddard Space Flight Center
-
Animator
- Alex Kekesi (Global Science and Technology, Inc.)
-
Video editor
- Matthew R. Radcliff (USRA)
-
Narration
- Kate Ramsayer (Telophase)
- Matthew R. Radcliff (USRA)
- James R. Irons (NASA/GSFC)
-
Narrator
- Kasha Patel (Wyle Information Systems)
-
Producer
- Matthew R. Radcliff (USRA)
-
Scientist
- James R. Irons (NASA/GSFC)
-
Project support
- Aaron E. Lepsch (ADNET Systems, Inc.)
-
Videographers
- Matthew R. Radcliff (USRA)
- Rob Andreoli (Advocates in Manpower Management, Inc.)
Release date
This page was originally published on Monday, February 24, 2014.
This page was last updated on Wednesday, May 3, 2023 at 1:51 PM EDT.
Missions
This visualization is related to the following missions:Series
This visualization can be found in the following series:Tapes
This visualization originally appeared on the following tapes:-
Landsat Onion Skin Bands
(ID: 2014020)
Monday, February 24, 2014 at 5:00AM
Produced by - Walt Feimer (HTSI)
Related
- ID: 12754
 Produced Video
 - ID: 11469
 Produced Video
 - ID: 11490
 Produced Video
 - ID: 4040
 Visualization