Sun Magnetic Field Flip Live Shots and Media Resources
On Dec. 6, 2013, NASA scientists Alex Young and Holly Gilbert discussed how the sun's magnetic field is in the process of flipping.
Alex Young is interviewed about the current solar cycle and what a magnetic flip means for the earth and NASA's study of magnetic fields.
Watch this video on the NASA Goddard YouTube channel.
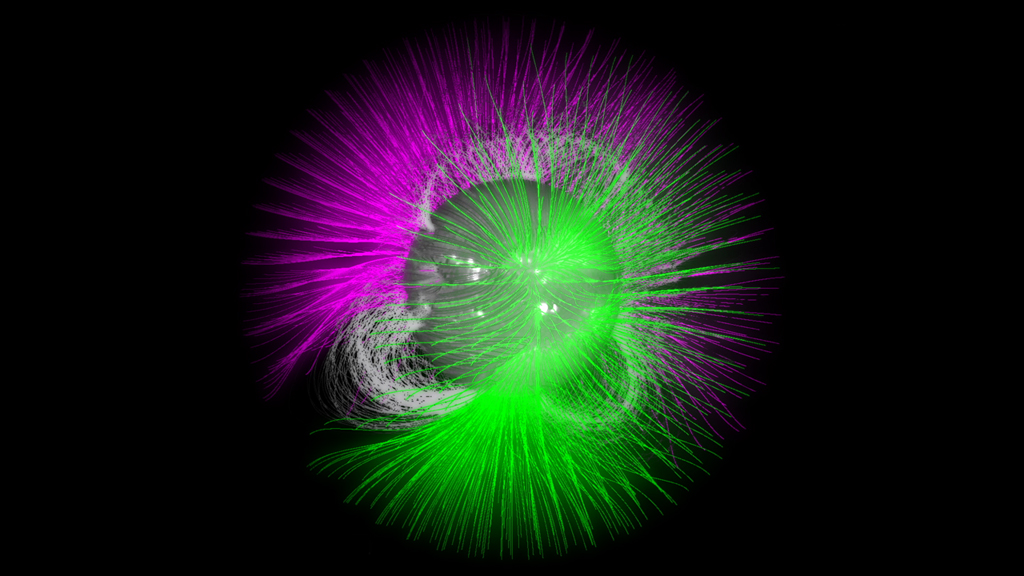
This visualization shows the position of the sun's magnetic fields from January 1997 to December 2013. The field lines swarm with activity: The magenta lines show where the sun's overall field is negative and the green lines show where it is positive. Additional gray lines represent areas of local magnetic variation. The entire sun's magnetic polarity, flips approximately every 11 years – though sometimes it takes quite a bit longer – and defines what's known as the solar cycle. The visualization shows how in 1997, the sun shows the positive polarity on the top, and the negative polarity on the bottom. Over the next 16 years, each set of lines is seen to creep toward the opposite pole. By the end of the movie, the flip is almost complete. At the height of each magnetic flip, the sun goes through periods of more solar activity, during which there are more sunspots, and more eruptive events such as solar flares and coronal mass ejections, or CMEs. The point in time with the most sunspots is called solar maximum.

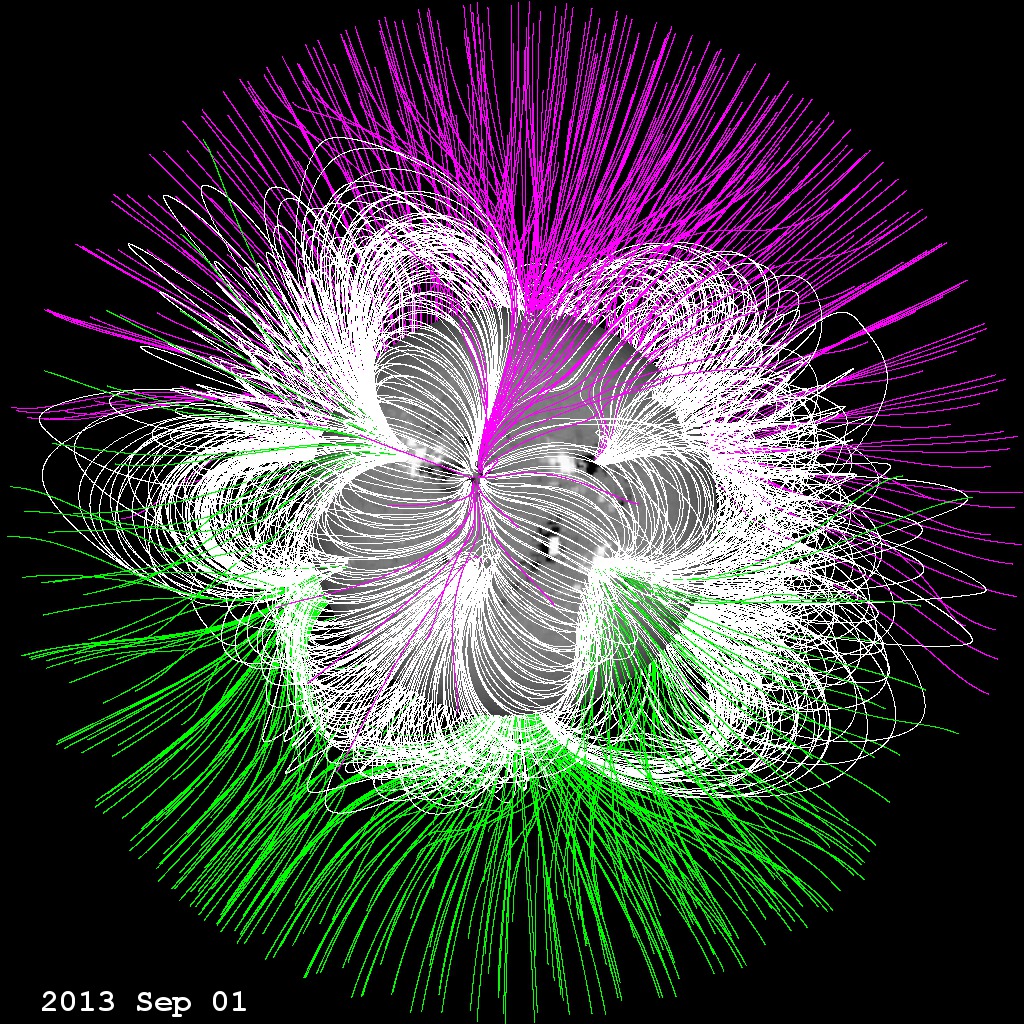
Image showing the sun's magnetic fields on Jan. 1, 1997, June 1, 2003, and Dec. 1, 2013. Green indicates postive polarity. Purple is negative.
Image shows magnetic fields radiating from the sun's poles.
Image shows the magnetic fields of the sun have flipped from the previous image. The blue lines are now at top of the sun and red at the bottom.
For More Information
Credits
Please give credit for this item to:
NASA's Goddard Space Flight Center
-
Animator
- Tom Bridgman (Global Science and Technology, Inc.)
-
Video editor
- Michael Randazzo (Advocates in Manpower Management, Inc.)
-
Producer
- Michelle Handleman (USRA)
-
Scientists
- C. Alex Young (NASA/GSFC)
- Holly Gilbert (NASA/GSFC)
-
Project support
- Genna Duberstein (USRA)
- Scott Wiessinger (USRA)
-
Videographer
- Rob Andreoli (Advocates in Manpower Management, Inc.)
Release date
This page was originally published on Thursday, December 5, 2013.
This page was last updated on Wednesday, May 3, 2023 at 1:51 PM EDT.
Missions
This visualization is related to the following missions:Related
- ID: 11419
 Produced Video
 - ID: 4124
 Visualization
Used as a Source In
- ID: 13642
![Watch this video on the NASA Goddard YouTube channel.Music credits: “End of Days - Joe Mason Remix” by Connor Shambrook [BMI], Cyrus Reynolds [BMI], Flynn Hase Spence [ASCAP], Joseph Scott Mason [APRA]; “Brainstorming” by Laurent Dury [SACEM]; “Flight of the Leaf Remix” by Julie Gruss [GEMA], Laurent Dury [SAXEM]; “Ticks and Thoughts” by Laurent Dury [SACEM]; “Intimate Journey” by Laurent Vernerey [SACEM], Nicolas de Ferran [SACEM] from Universal Production MusicComplete transcript available.](/vis/a010000/a013600/a013642/13642_IBEX11years_YouTube.00214_print.jpg) Produced Video
Produced Video - ID: 13527
![VideoWatch this video on the NASA Goddard YouTube channel.Music credits: “Oxide” and “Virtual Tidings” by Andrew Michael Britton [PRS], David Stephen Goldsmith [PRS]; “Progressive Practice” by Emmanuel David Lipszc [SACEM], Franck Lascombes [SACEM], Sebastien Lipszyc [SACEM]; “Political Spectrum” by Laurent Dury [SACEM} from Universal Production MusicComplete transcript available.](/vis/a010000/a013500/a013527/13537_SolarOrbiterOverview_YouTube.00725_print.jpg) Produced Video
Produced Video