IRIS First Light
The images and video on this page are from the IRIS first light media teleconference on July 25, 2013.
For supporting media resources, please click here.
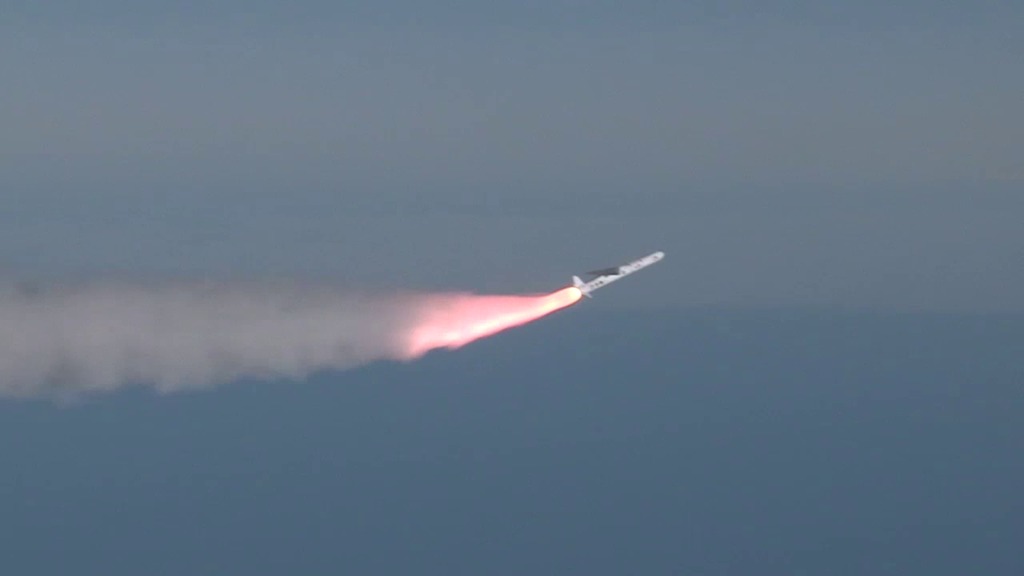
On July 17, 2013 at 11:14 pm PDT (2:14 pm EDT) the IRIS Lockheed Martin instrument team successfully opened the door on NASA’s Interface Region Imaging Spectrograph, which launched June 27, 2013, aboard a Pegasus XL rocket from Vandenberg Air Force Base, Calif.
As the telescope door opened, IRIS’s single instrument began to observe the sun for the first time. Designed to research the interface region in more detail than has ever been done before, IRIS’s instrument is a combination of an ultraviolet telescope and a spectrograph. The telescope provides high-resolution images, capturing data on about 1 percent of the sun at a time. The images can resolve very fine features, as small as 150 miles across.
While the telescope can look at only one wavelength of light at a time, the spectrograph collects information about many wavelengths of light at once. The instrument then splits the sun’s light into its various wavelengths and measures how much of any given wavelength is present. Analysis of the spectral lines can also provide velocity, temperature and density information, key information when trying to track how energy and heat moves through the region.

This is a photo of the complete IRIS observatory with the solar arrays deployed. This photo was taken in a large clean tent at LM prior to vibration testing and prior to installation of the flight MLI blankets. The front door, the aluminum disk to the far left end of the telescope tube, is now open and the observatory carrying out its solar observing mission.
Credit: LM photo
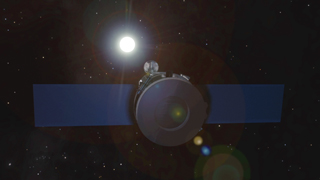
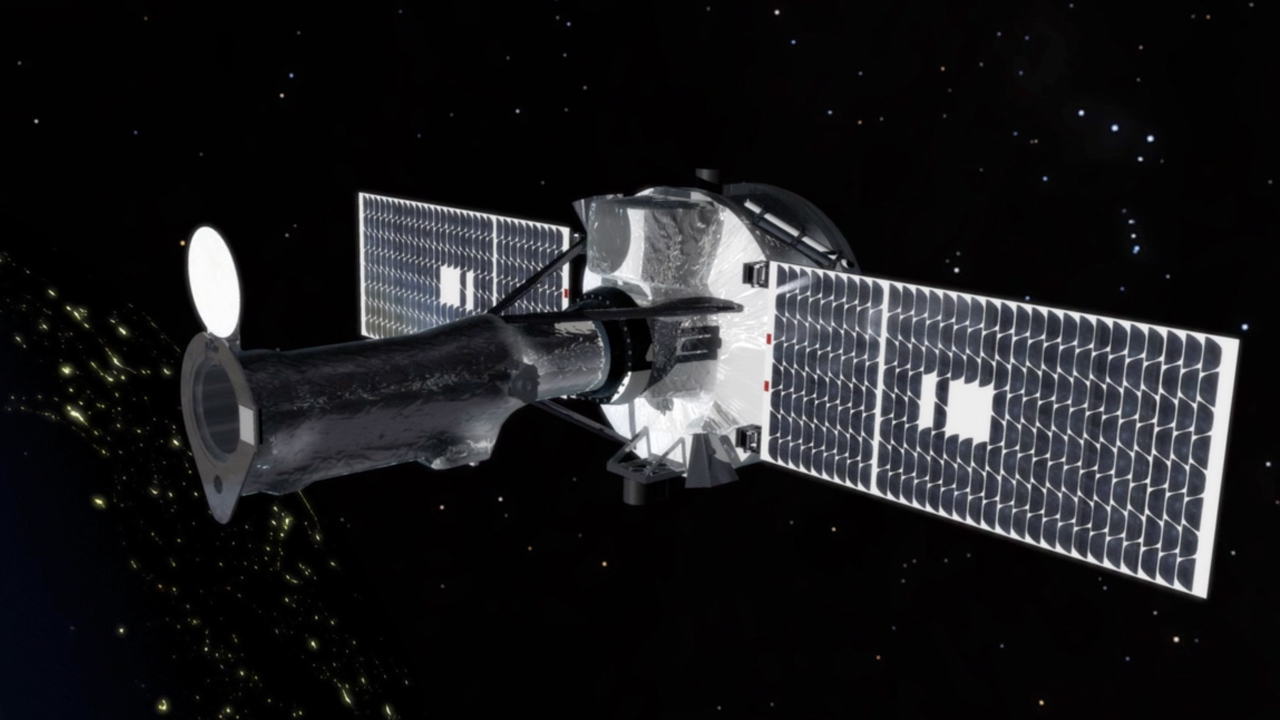
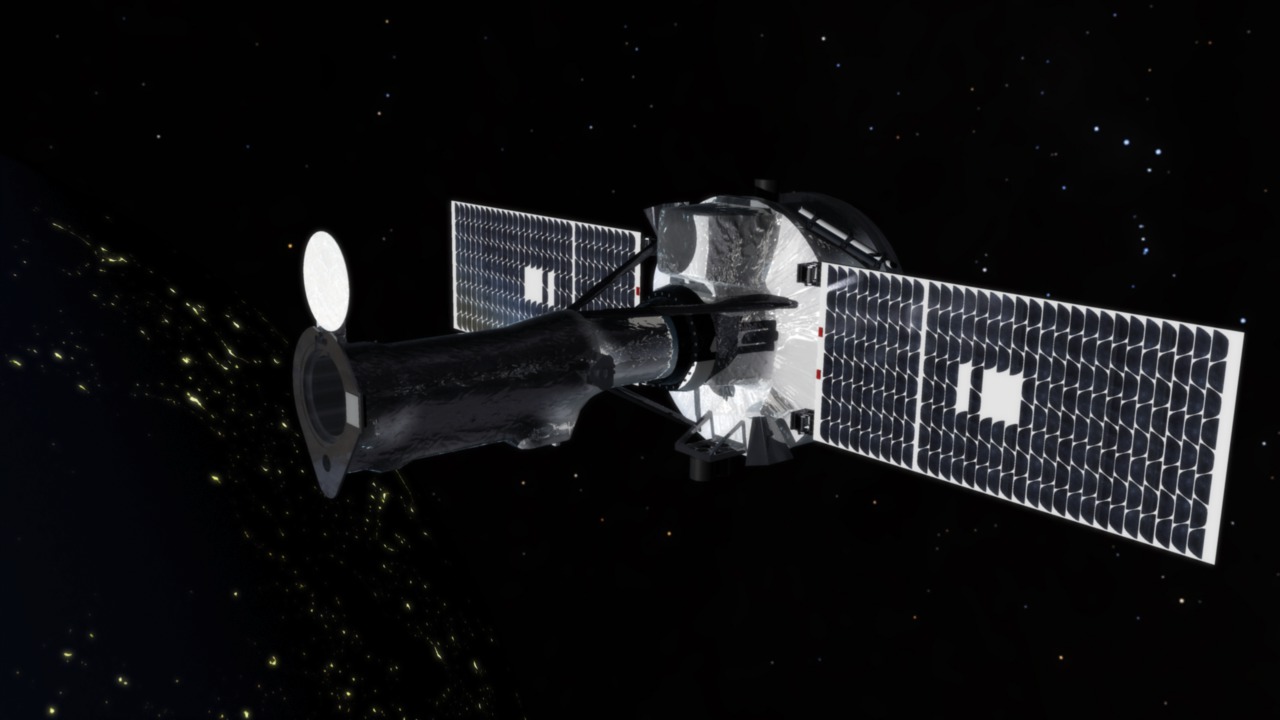
This animation shows the launch and deployment in space of the IRIS observatory. IRIS was launched on June 27, 2013 at 7:27pm PDT and achieved orbit at 7:46pm. The third stage of the Pegasus rocket placed the observatory in a nearly perfect 620km x 660km orbit allowing for 8 months of eclipse free viewing for at least 6 years.
Credit: NASA/Goddard Space Flight Center/Conceptural Image Lab
This animation shows the opening of the telescope aperture door. The door was opened on July 17, 2013 on the 20th day of the mission. The primary reason for delaying the door opening was to allow sufficient time for any additional outgassing that occurs in the higher vacuum of space. This also allows for the checkout of the spacecraft and instrument systems that could be performed with the door closed.
Credit: NASA/Goddard Space Flight Center/Conceptural Image Lab
This is the IRIS mission timeline from launch including separation from the third stage, deployment of the solar arrays and the transition from detumble mode to coarse sun pointing mode.
Credit: NASA Ames Research Center/IRIS
This timeline shows the IRIS mission timeline for the nominal two year mission including the transition from engineering checkout, science calibrations, to fully operational science observing.
Credit: NASA Ames Research Center/IRIS
The left hand panel shows an AIA image in the 1700 angstrom band. On the right panel is the is the region outlined in green s at the full resolution of AIA.
Credit: NASA/SDO/LMSAL/AIA/IRIS
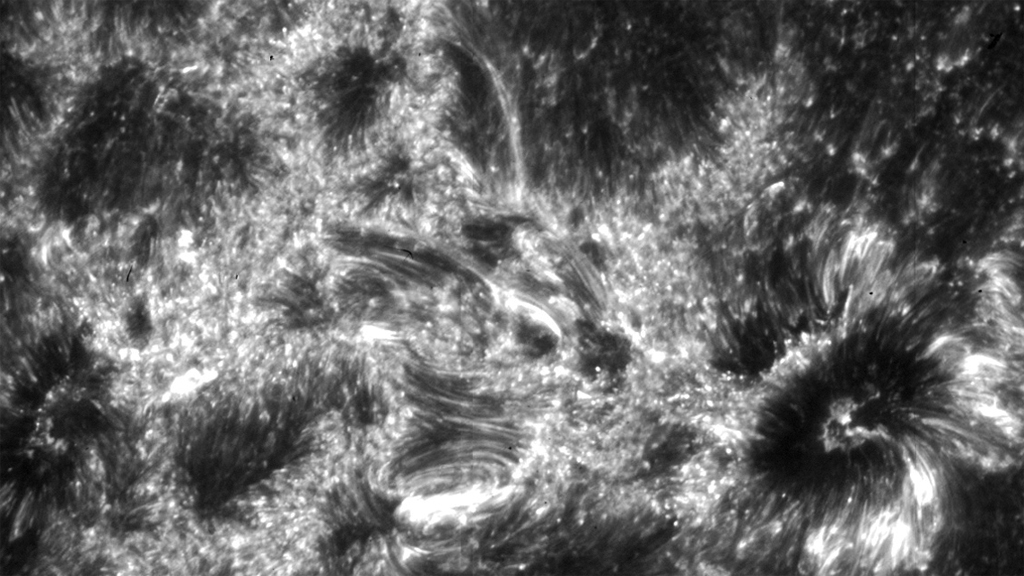
On the left hand panel is the right hand panel on the first slide. On the right panel is the region outlined in pink as seen b=in Si IV by IRIS at the same time. There are 12.7 IRIS pixels for every AIA pixel. The smallest structures in the IRIS image are about 240 km wide on the Sun.
Credit: NASA/SDO/LMSAL/AIA/IRIS
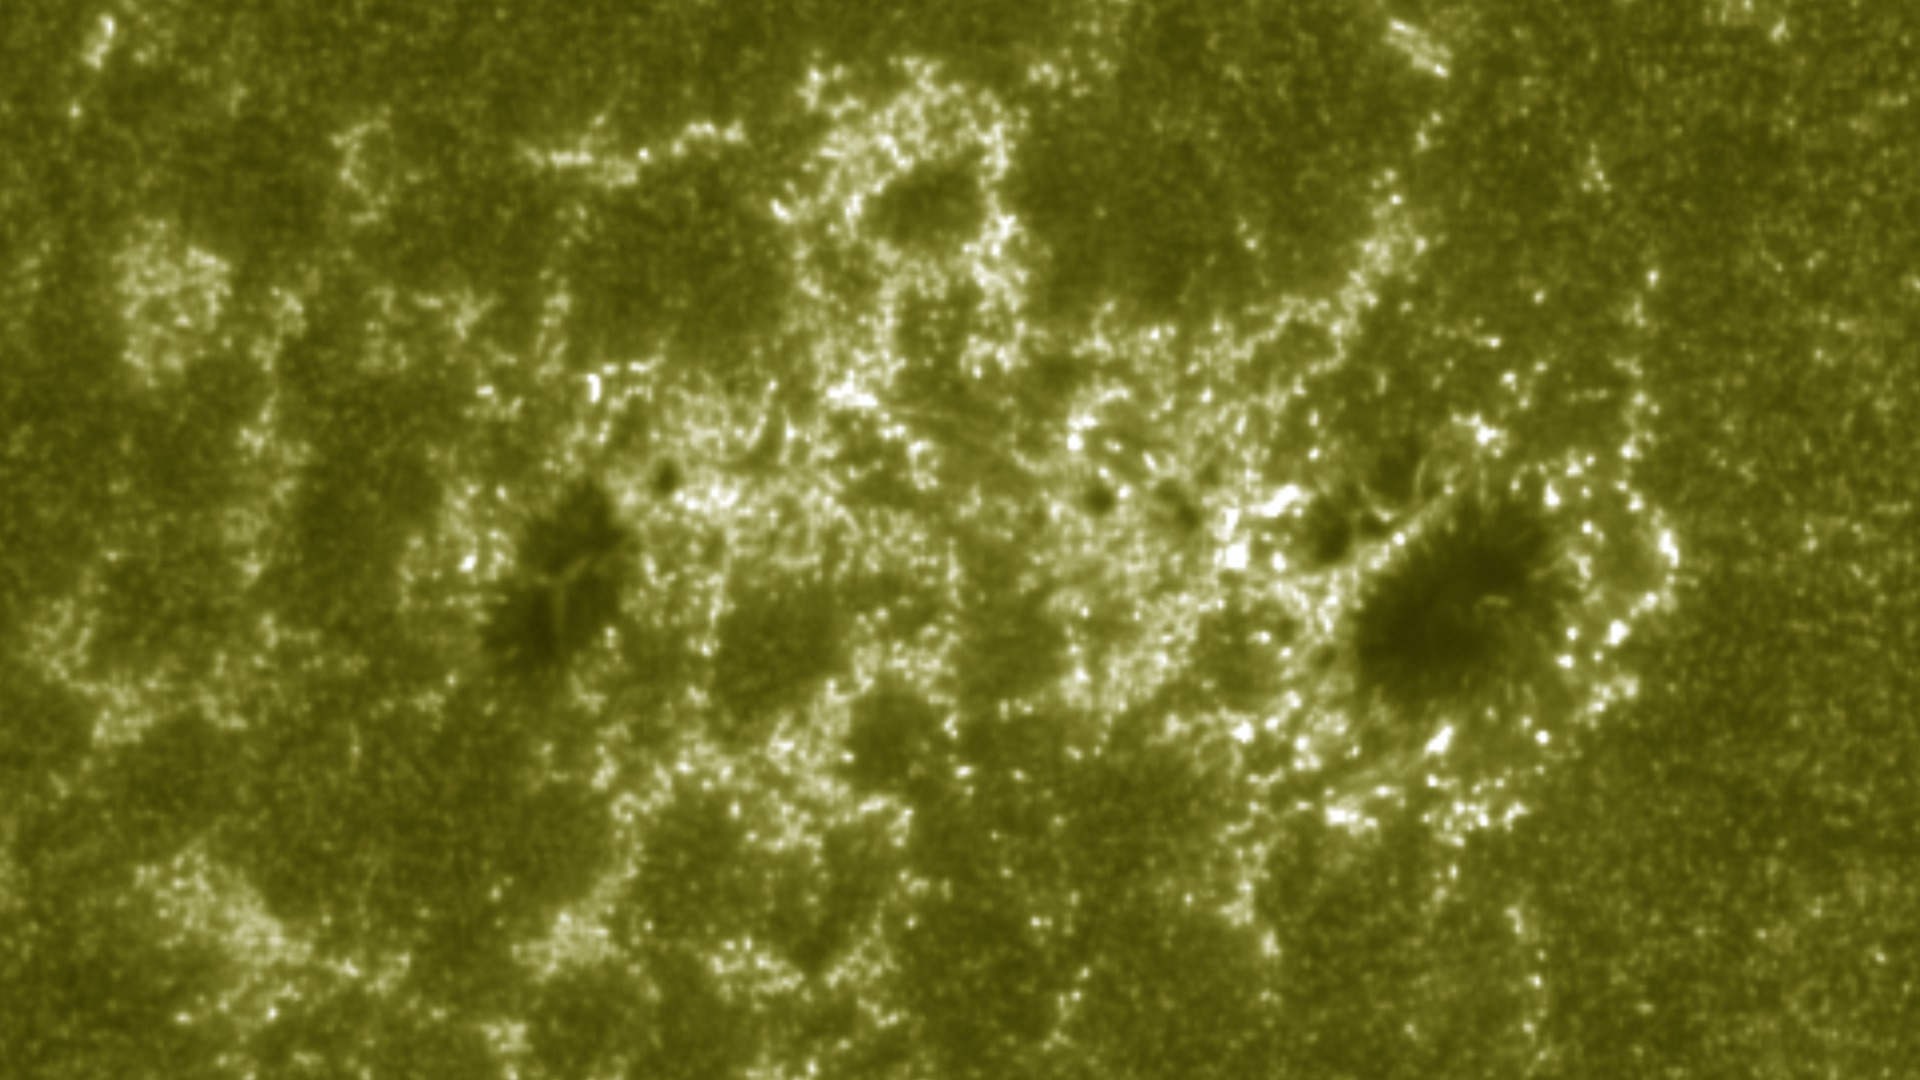
This is the first movie made with IRIS. Most frames are separated by 24 seconds. This data was taken in an early calibration run and was not intended for science studies. The movie started only 21 hours after opening the front door.
Images will improve in quality when the corrections for gain and dark current of the detector are calibrated and applied. Further cosmetic improvements will occur after we learn to properly scale the images.
The IRIS images have a dynamic range that is much higher than normally seen in AIA mages.
This video has been slowed forty percent and looped four times to show greater detail.
Credit: NASA GSFC/LMSAL/IRIS
IRIS Near Ultraviolet Spectrum containing the Mg II h and Mg II k spectral lines formed by single ionized Magnesium atoms in the solar chromosphere (bright vertical features), the region between the solar surface and the sun's outer atmosphere. The horizontal axis shows wavelength, with the vertical axis showing the spatial direction. The vertical black lines are spectral lines formed on the Sun's surface. These spectra are used to determine velocities and temperatures of the emitting gas for a range of heights from the surface of the Sun to several thousand kilometer above the Sun's surface.
The horizontal yellow line shows the cut that is used to create the movie in the following image.
Credit: Lockheed Martin Solar & Astrophysics Laboratory, Palo Alto, CA.
This video is same as image above, but now a line plot of the spectrum is shown for the points along the yellow line. The spectra here are shown for various locations on the Sun. The changes in the movie are caused by differing physical conditions in the locations.
Credit: Lockheed Martin Solar & Astrophysics Laboratory, Palo Alto, CA.
This video is similar to the video above, but now as derived from a numerical simulation of the Sun by the University of Oslo.
Credit: Dr. Tiago Pereira, University of Oslo.
This unlabeled image compares SDO AIA 1600 angstroms to IRIS Si IV.
Credit: NASA/SDO/IRIS
Still image from the first IRIS movie, 21 hours after opening the door.
Credit: NASA/IRIS
Video comparing SDO AIA and IRIS Si VI
Credit: NASA/SDO/IRIS
Credits
Please give credit for this item to:
NASA's Goddard Space Flight Center
-
Animator
- Tom Bridgman (Global Science and Technology, Inc.)
-
Producer
- Genna Duberstein (USRA)
-
Scientists
- Alan Title (LMSAL)
- Bart De Pontieu (Lockheed Martin Solar and Astrophysics Lab)
- Gary Kushner (LMSAL)
Release date
This page was originally published on Thursday, July 25, 2013.
This page was last updated on Wednesday, May 3, 2023 at 1:51 PM EDT.
Missions
This visualization is related to the following missions:Related
- ID: 11448
 Produced Video
 - ID: 4091
 Visualization
 - ID: 11313
 Produced Video
 - ID: 11256
- ID: 11286
 Produced Video
 - ID: 11089
 Produced Video