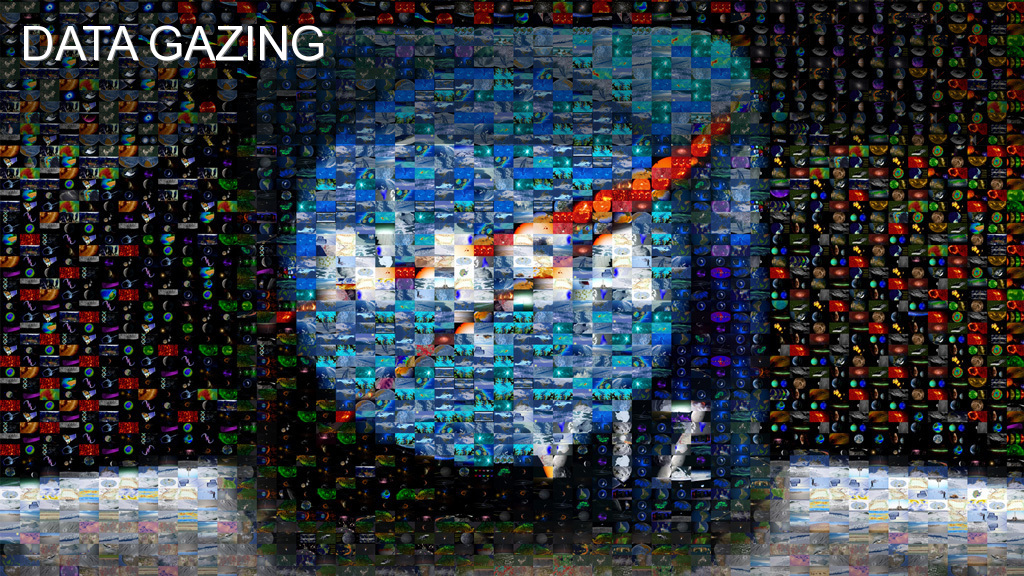
Data Gazing
A year ago today we launched NASA Visualization Explorer, an app designed to deliver captivating illustrations grounded in data gathered by cutting-edge NASA spacecraft. After producing more than 100 stories our goal remains the same: Put the science first and let data visualization bring into focus the natural events and changes taking place on Earth and beyond. But sometimes we just want to sit back, take in the amazing images and let our minds wander. This is one of those moments. The video highlights some of the best illustrations from this year's stories. As for what's coming out in year two—keep looking. You never know what you'll see.

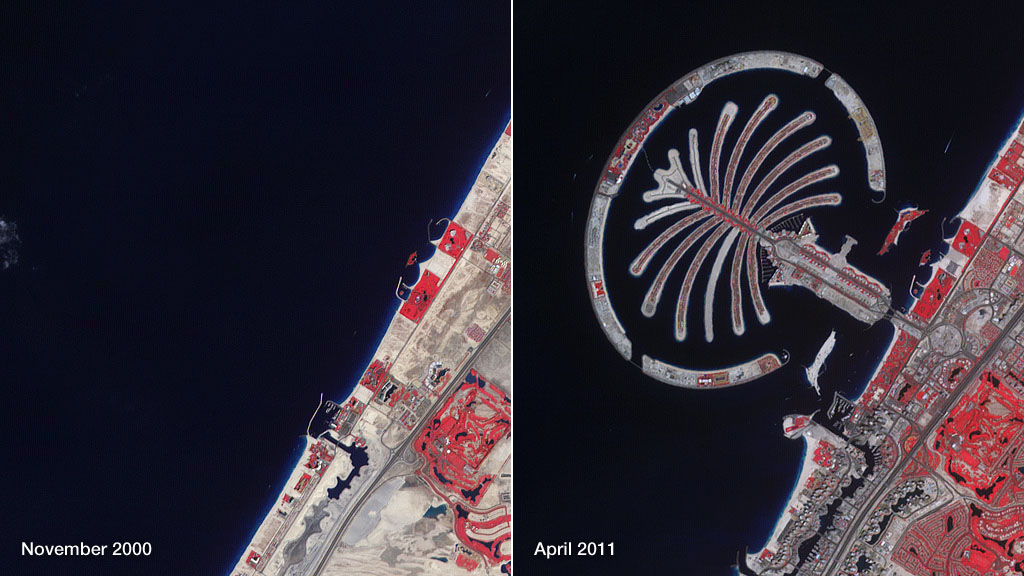
Blink and you would have missed construction of the palm-shaped island off the coast of Dubai.
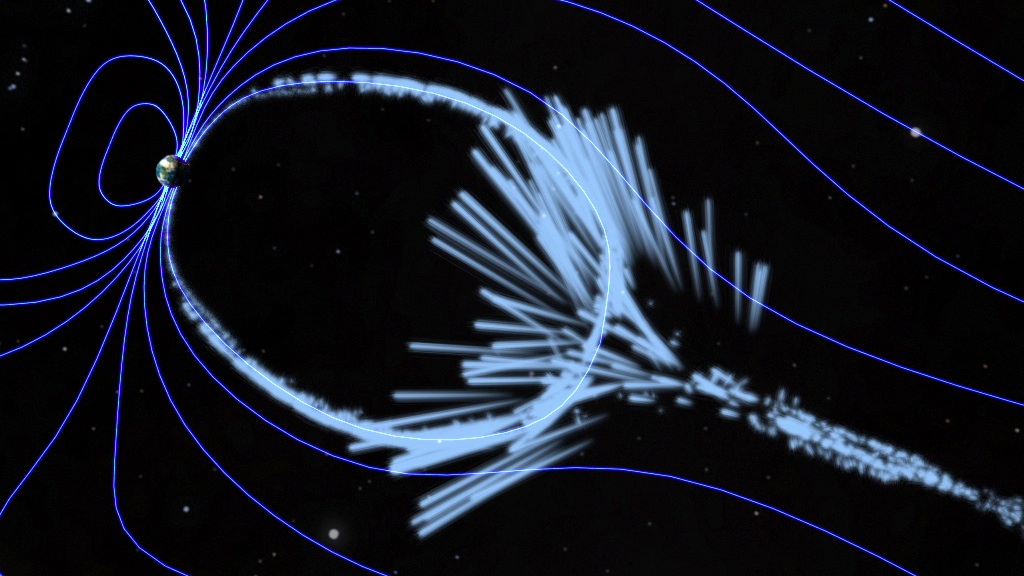
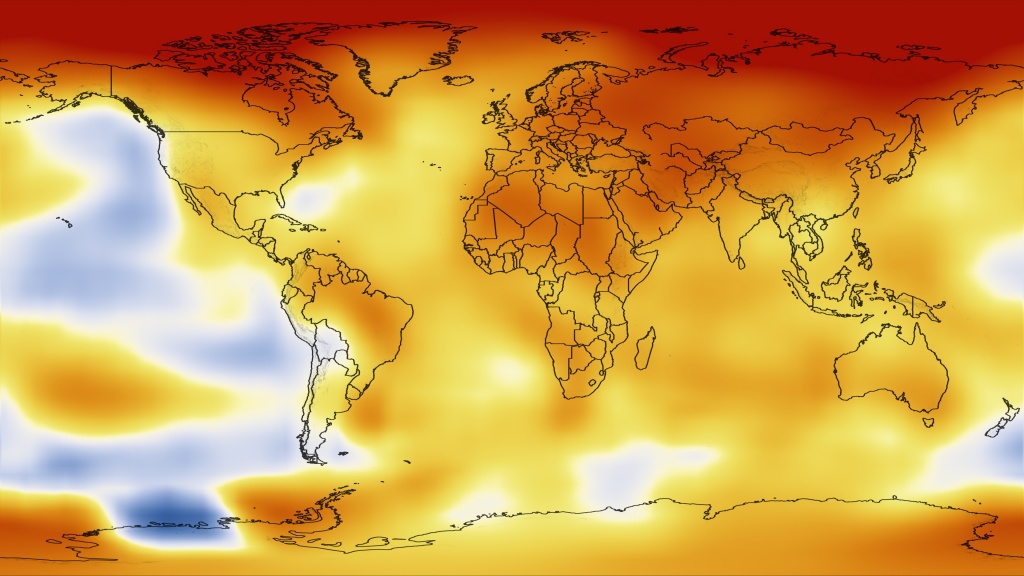
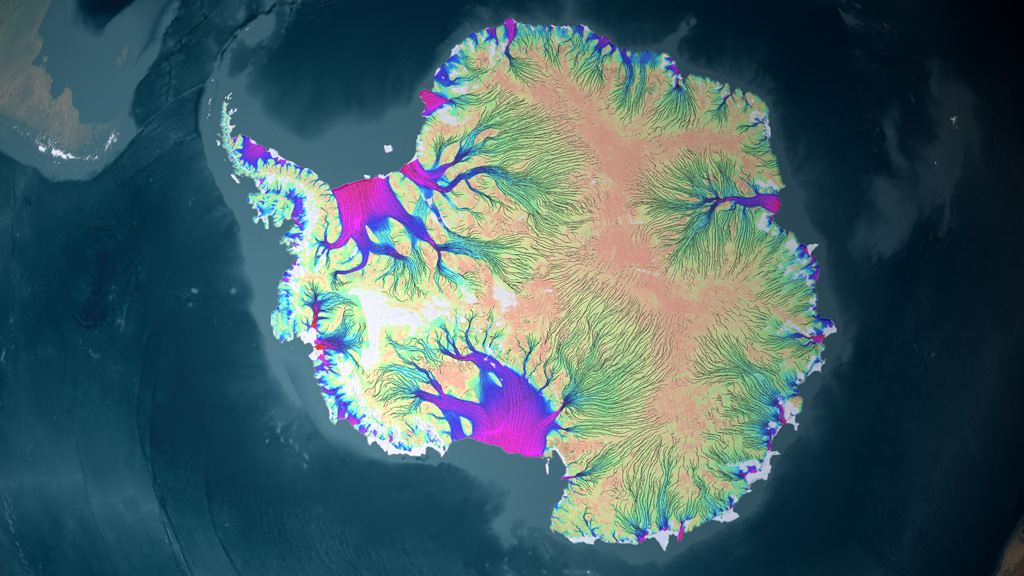
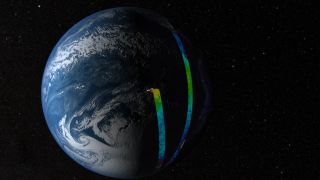
Antarctica's migrating ice resembles a connected system of capillaries, veins and arteries.
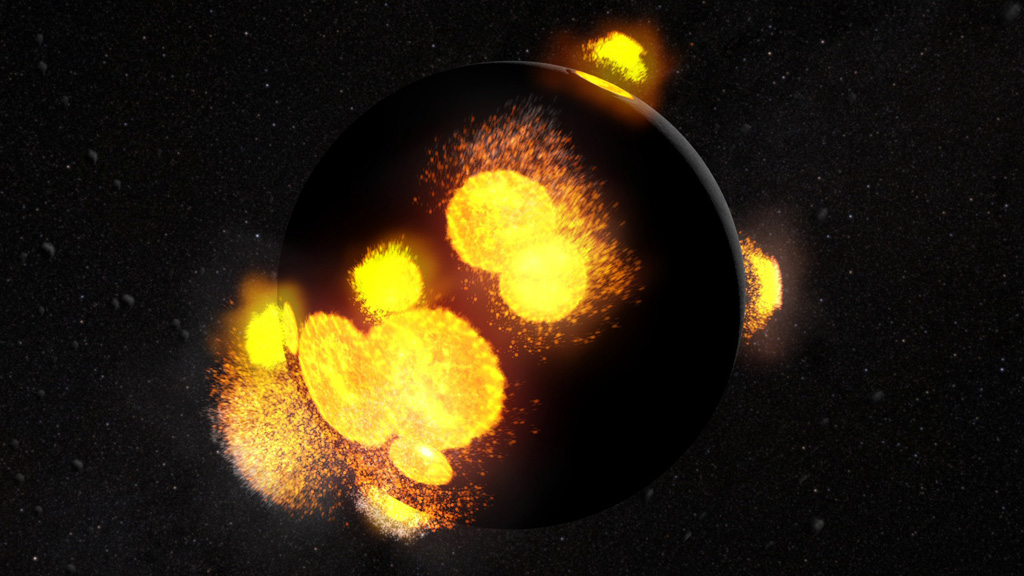
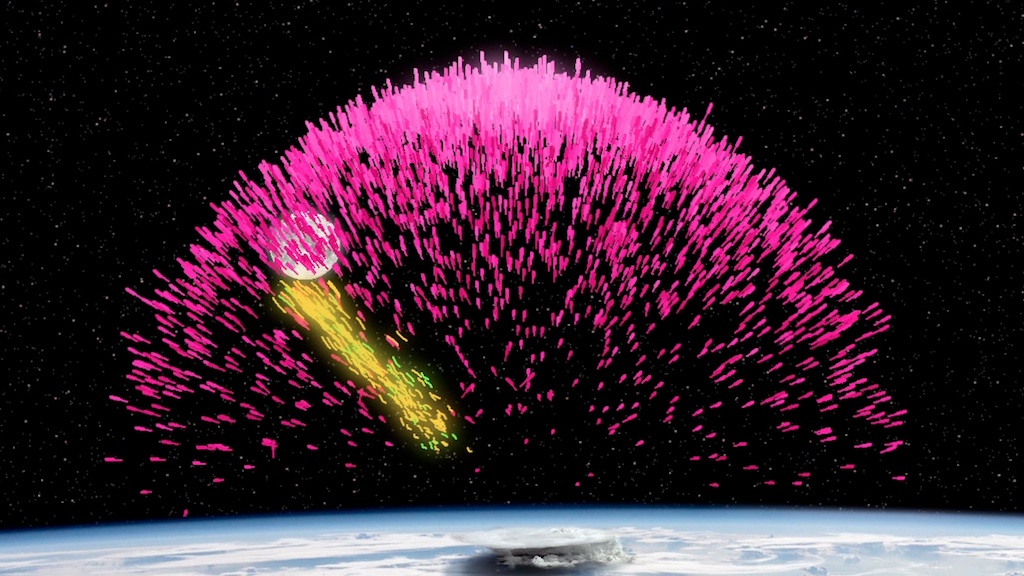
Growing pains: As a kid the moon was covered in liquid hot magma.
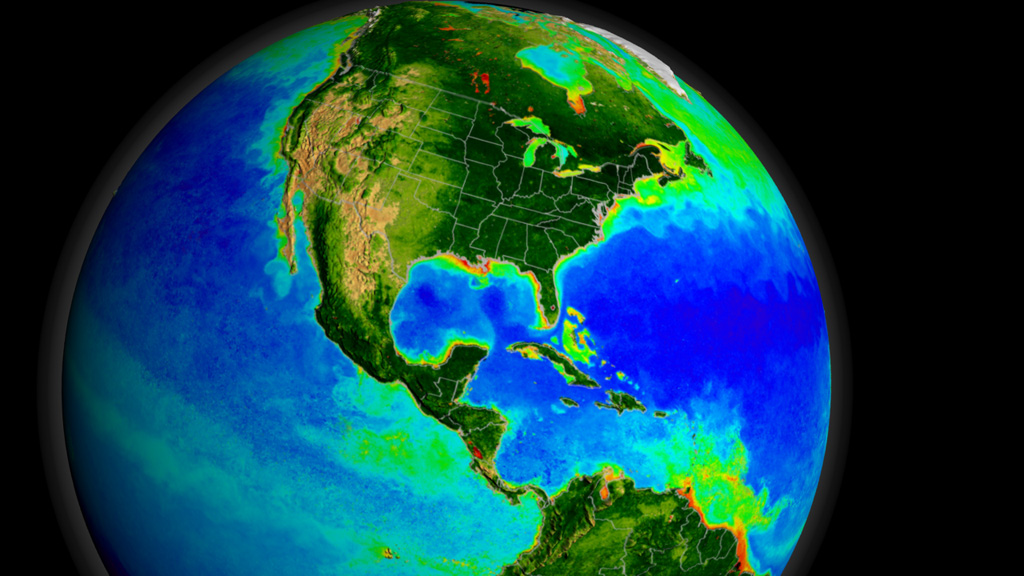
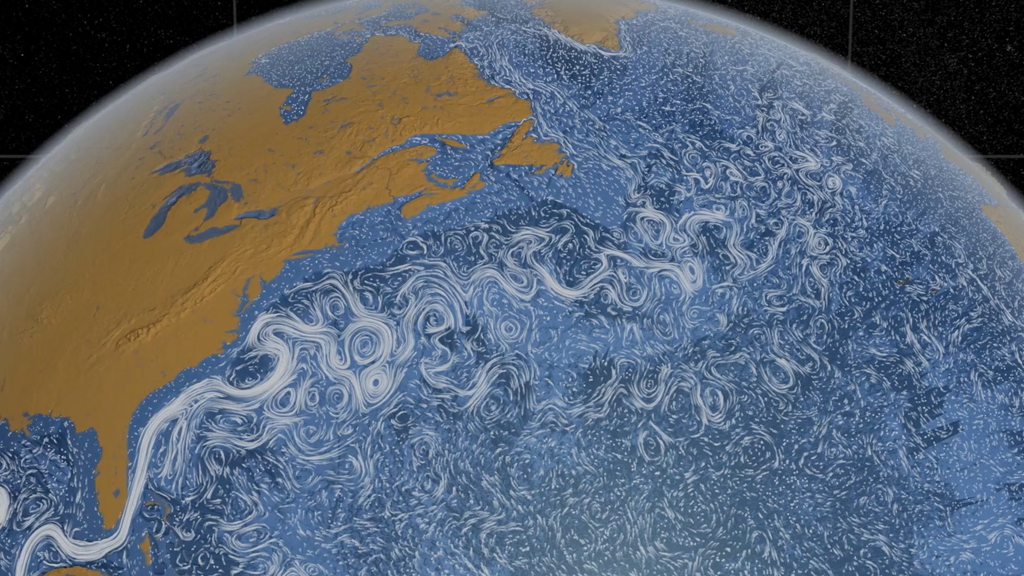
You could use a microscope to see one or two phytoplankton—or a satellite to view entire colonies.
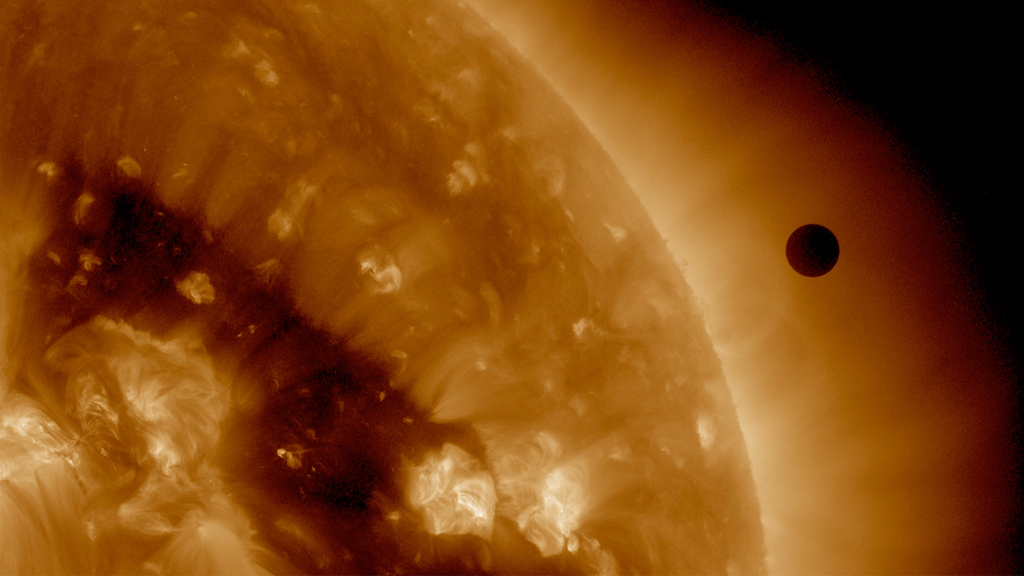
Is it a bird? A plane? A hole punched in space? No. It's just Venus crossing the sun.
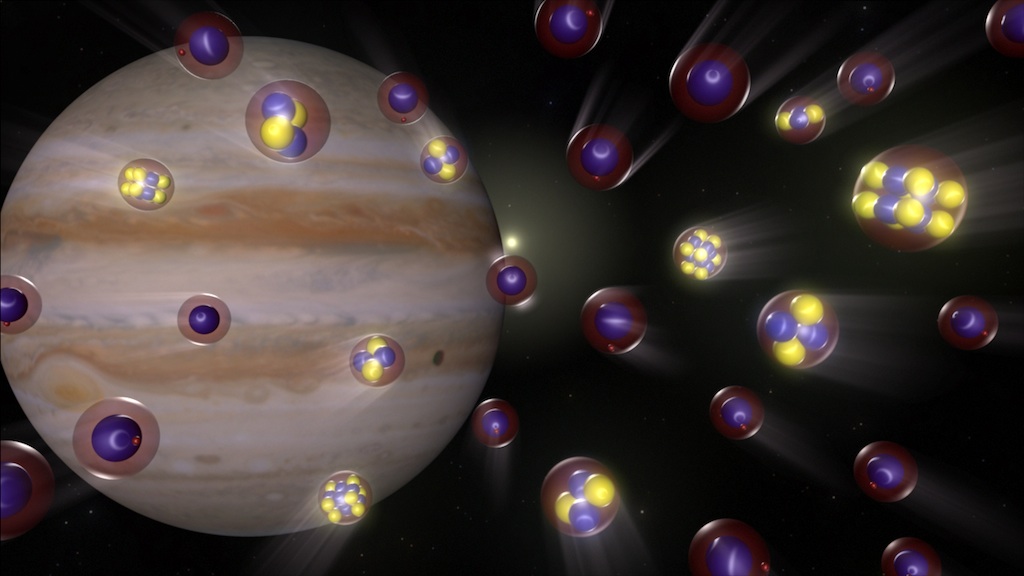
Exploring the universe bit by bit.
Science you can groove to: Turn up the volume on this NASA Viz music video.
Credits
Please give credit for this item to:
NASA's Goddard Space Flight Center
Dubai image courtesy of NASA Earth Observatory
-
Video editor
- Kayvon Sharghi (USRA)
-
Producer
- Kayvon Sharghi (USRA)
-
Writer
- Patrick Lynch (Wyle Information Systems)
Release date
This page was originally published on Thursday, July 26, 2012.
This page was last updated on Wednesday, May 3, 2023 at 1:52 PM EDT.
Related
- ID: 3914
 Visualization
 - ID: 11013
 Produced Video
 - ID: 10986
 Produced Video
 - ID: 10965
 Produced Video
 - ID: 10971
 Produced Video
 - ID: 10954
 Produced Video
 - ID: 10931
 Produced Video
 - ID: 10918
 Produced Video
 - ID: 10917
 Produced Video
 - ID: 10901
 Produced Video
 - ID: 10900
 Produced Video
 - ID: 10894
 Produced Video
 - ID: 10834
 Produced Video
 - ID: 10866
 Produced Video
 - ID: 10841
 Produced Video
 - ID: 3849
 Visualization
 - ID: 10771
 Produced Video
 - ID: 10714
 Produced Video
 - ID: 3832
 Visualization