Dissecting Isabel
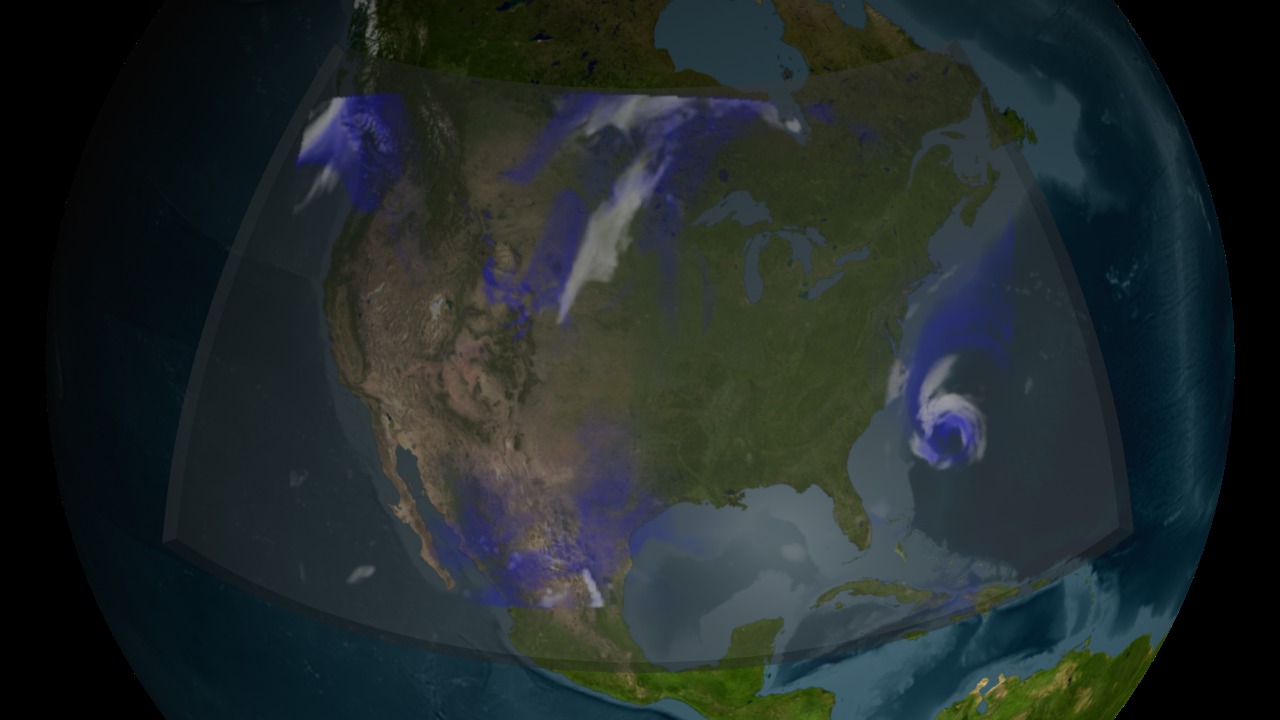
After weakening from a Category 5 storm over the Atlantic Ocean, Hurricane Isabel made landfall on September 18, 2003, at North Carolina's Outer Banks with Category 2 status, then skirted up the U.S. coast as a tropical storm. Researchers tracked the storm from the ground, air and space, but observations can't reveal all of a storm's inner workings. So models are used to explore the physical processes associated with storm formation, structure and intensification. Calculations are performed within a virtual cube of the atmosphere, creating a 3D version of the storm. Details revealed could help forecasters more accurately predict the path and intensity of hurricanes. This NASA visualization merges global and regional data into a high-resolution weather model to recreate Hurricane Isabel. Watch the simulated features of the storm, from spinning winds and spiral cloud bands, to a realistic eye-like center.

A computer simulation exposes the turbulent anatomy of a Category 2 hurricane.
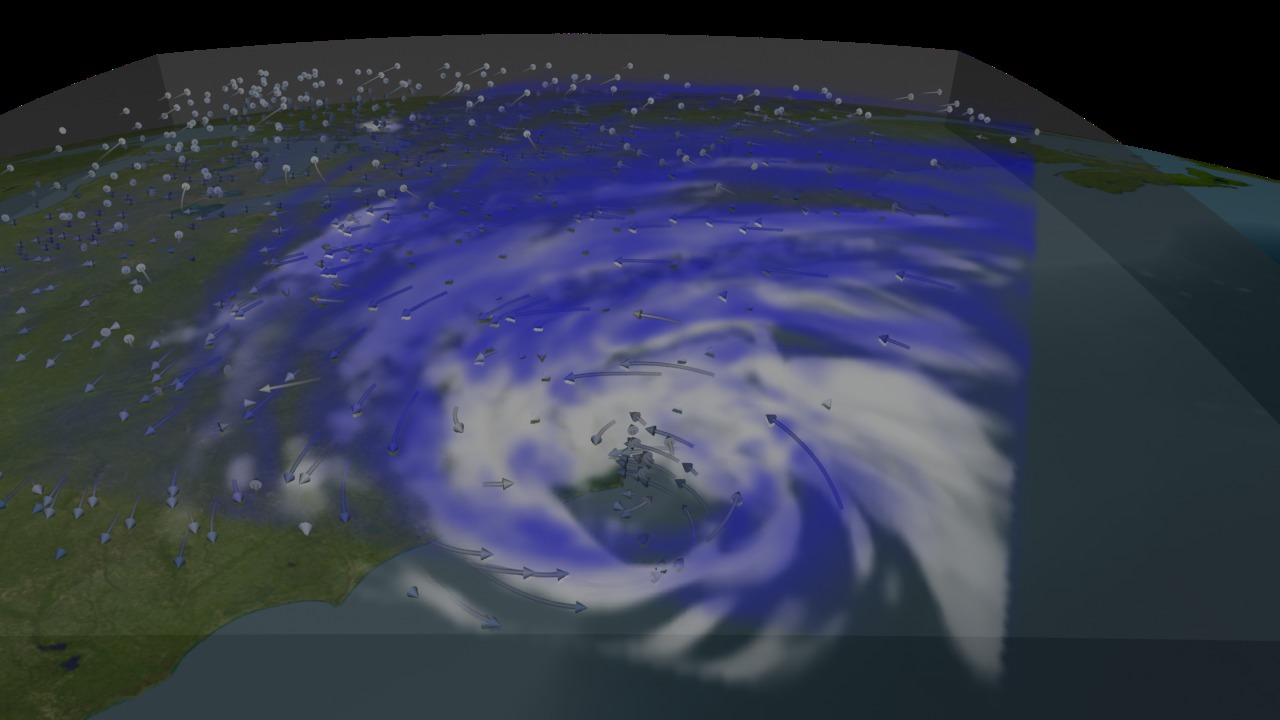
Hurricane Isabel's strong winds (blue, white arrows) and whirling clouds made of water (white) and ice (blue) hit the eastern United States.
In northern hemisphere hurricanes, low pressure drives strong winds at lower altitudes (blue arrows) to spin counterclockwise and inward.
Winds at higher altitudes (white arrows) drop off rapidly and can even begin rotating in the opposite direction, spiraling outward and clockwise.
Hurricane Isabel observed from the vantage of the International Space Station.
Credits
Please give credit for this item to:
NASA's Goddard Space Flight Center
ISS image courtesy of Johnson Space Center
-
Animators
- Greg Shirah (NASA/GSFC)
- Horace Mitchell (NASA/GSFC)
-
Video editor
- Kayvon Sharghi (USRA)
-
Producer
- Michael Starobin (HTSI)
-
Scientist
- Tsendgar J. Lee (NASA/HQ)
-
Writer
- Kathryn Hansen (Wyle Information Systems)
Release date
This page was originally published on Thursday, July 5, 2012.
This page was last updated on Wednesday, May 3, 2023 at 1:52 PM EDT.