NASA's Fermi Space Telescope Explores New Energy Extremes
After more than three years in space, NASA's Fermi Gamma-ray Space Telescope is extending its view of the high-energy sky into a range that to date has been largely unexplored territory. Now, the Fermi team has presented its first "head count" of sources in this new realm.
Fermi's Large Area Telescope (LAT) scans the entire sky every three hours, continually deepening its portrait of the sky in gamma rays, the most extreme form of light. While the energy of visible light falls between about 2 and 3 electron volts, the LAT detects gamma rays with energies ranging from 20 million electron volts (MeV) to more than 300 billion (GeV).
But at higher energies, gamma rays are few and far between. Above 10 GeV, even Fermi's LAT detects only one gamma ray every four months from some sources. The LAT's predecessor, the EGRET instrument on NASA's Compton Gamma Ray Observatory, detected only 1,500 individual gamma rays in this range during its nine-year lifetime, while the LAT detected more than 150,000 in just three years.
Any object producing gamma rays at these energies is undergoing extraordinary astrophysical processes. More than half of the 496 sources in the new census are active galaxies, where matter falling into a supermassive black hole powers jets that spray out particles at nearly the speed of light.

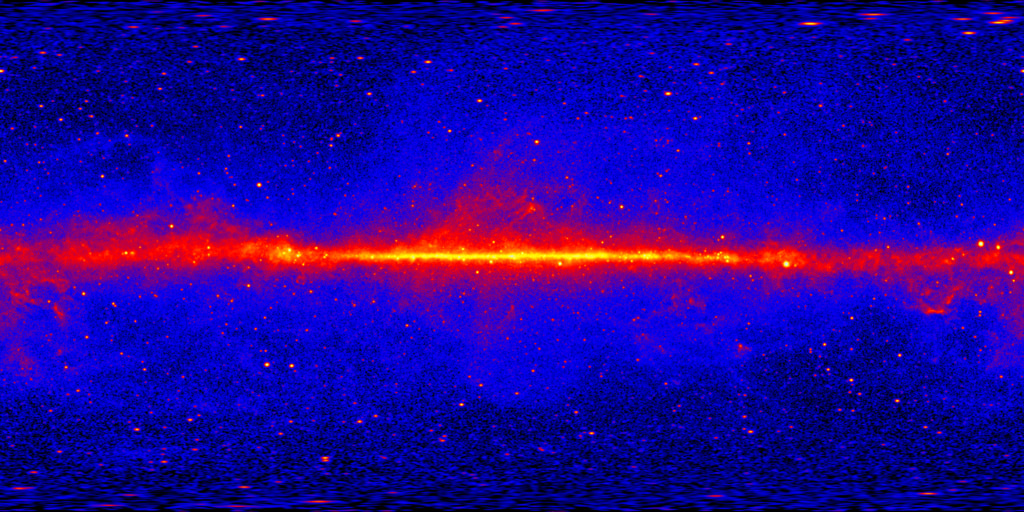
Fermi's view of the gamma-ray sky continually improves. This image of the entire sky includes three years of observations by Fermi's Large Area Telescope (LAT). It shows how the sky appears at energies greater than 1 billion electron volts (1 GeV). Brighter colors indicate brighter gamma-ray sources. A diffuse glow fills the sky and is brightest along the plane of our galaxy (middle). Discrete gamma-ray sources include pulsars and supernova remnants within our galaxy as well as distant galaxies powered by supermassive black holes.
Credit: NASA/DOE/Fermi LAT Collaboration

This all-sky Fermi view includes only sources with energies greater than 10 GeV. From some of these sources, Fermi's LAT detects only one gamma-ray photon every four months. Brighter colors indicate brighter gamma-ray sources.
Credit: NASA/DOE/Fermi LAT Collaboration

New sources emerge and old sources fade as the LAT's view extends into higher energies.
Credit: NASA/DOE/Fermi LAT Collaboration and A. Neronov et al.

More than half of the sources above 10 GeV are black-hole-powered active galaxies. More than a third of the sources are completely unknown, having no identified counterpart detected in other parts of the spectrum.
Credits
Please give credit for this item to:
NASA/Goddard Space Flight Center. However, individual images should be credited as indicated above.
-
Producer
- Scott Wiessinger (USRA)
-
Science writer
- Francis Reddy (University of Maryland College Park)
-
Graphics
- Francis Reddy (University of Maryland College Park)
Release date
This page was originally published on Tuesday, January 10, 2012.
This page was last updated on Wednesday, May 3, 2023 at 1:53 PM EDT.
Missions
This visualization is related to the following missions:Series
This visualization can be found in the following series:Tapes
This visualization originally appeared on the following tapes:-
Fermi and RXTE AAS releases
(ID: 2012005)
Tuesday, January 10, 2012 at 5:00AM
Produced by - Robert Crippen (NASA)
Datasets used in this visualization
-
[Fermi: LAT]
ID: 216Fermi Gamma-ray Large Area Space Telescope (GLAST) Large Area Telescope (LAT)
This dataset can be found at: http://fermi.gsfc.nasa.gov
See all pages that use this dataset -
[Fermi]
ID: 687
Note: While we identify the data sets used in these visualizations, we do not store any further details, nor the data sets themselves on our site.

