Las Vegas, 1972-2021
Timelapse animation of Lake Mead and the city of Las Vegas, Nevada, from 1972-2021, as captured by Landsat sensors. The images are false-color, showing healthy vegetation in red.
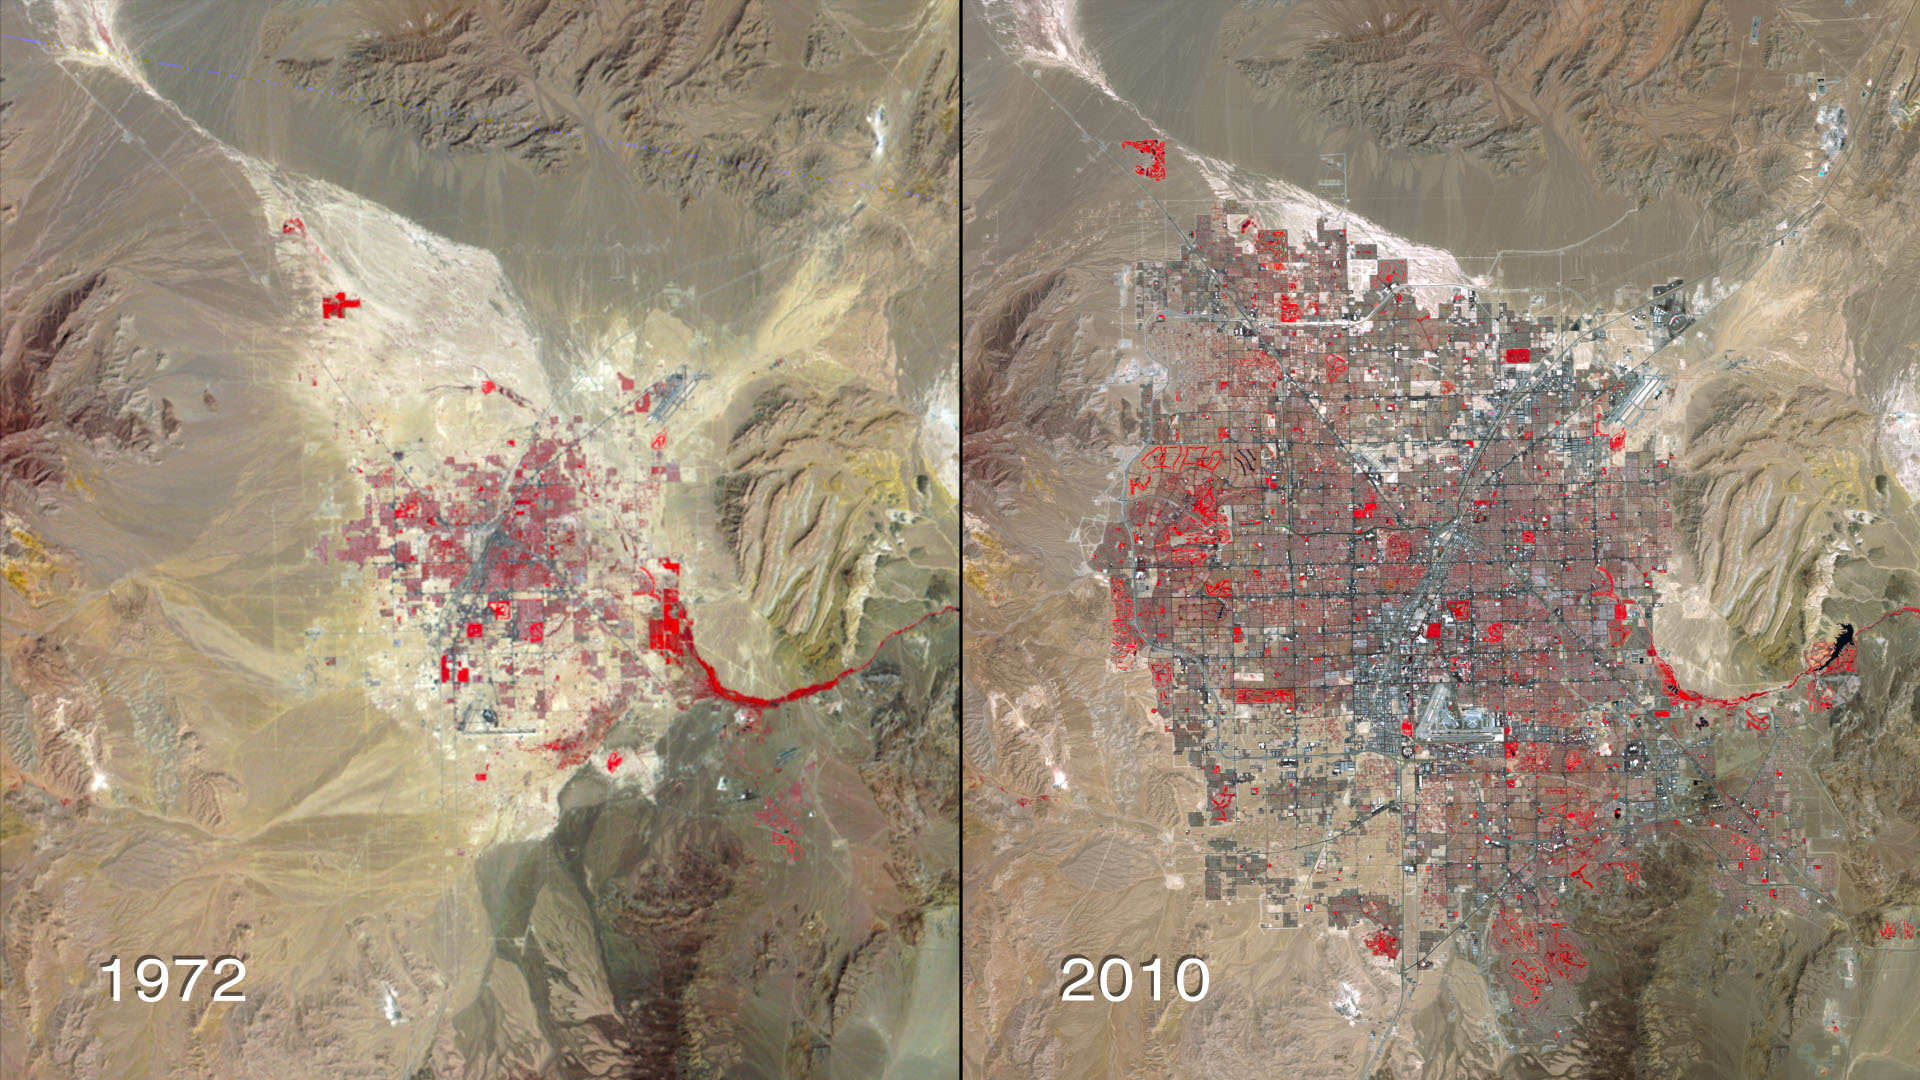
What Doesn't Stay in Vegas? Sprawl.
This image series shows the desert city's massive growth spurt since 1972. The outward expansion of the city is shown in a false-color time lapse of data from all the Landsat satellites.
The large red areas are actually green space, mostly golf courses and city parks. You'll notice the images become a lot sharper around 1984, when new instrument designs improved the ability to resolve smaller parcels of land.
These Las Vegas images were created using reflected light from the near-infrared, red and green portions of the electromagnetic spectrum (Landsat 8 OLI bands 5,4,3; Landsat 7 ETM+ and Landsat 5 TM bands 4,3,2; and Landsat 1-3 MSS bands 4,2,1).
Landsat data have been instrumental in increasing our understanding of forest health, storm damage, agricultural trends, urban growth, and many other ongoing changes to our land resources. Studies using Landsat data have helped land managers keep track of the pace of urbanization in locations around the world.
The Landsat Program is a series of Earth-observing satellite missions jointly managed by NASA and the U.S. Geological Survey (USGS). Landsat satellites have been consistently gathering data about our planet since 1972. They continue to improve and expand this unparalleled record of Earth's changing landscapes for the benefit of all.
Credits
Please give credit for this item to:
NASA/Goddard Space Flight Center
Landsat images obtained from USGS Earth Explorer
The Landsat Program is a series of Earth-observing satellite missions jointly managed by NASA and the U.S. Geological Survey.
-
Animator
- Marit Jentoft-Nilsen (RSIS)
-
Video editor
- Matthew R. Radcliff (USRA)
-
Producer
- Matthew R. Radcliff (USRA)
-
Scientist
- James R. Irons (NASA/GSFC)
-
Writer
- Aries Keck (ADNET Systems, Inc.)
Release date
This page was originally published on Monday, March 5, 2012.
This page was last updated on Wednesday, May 3, 2023 at 1:53 PM EDT.
Missions
This visualization is related to the following missions:Series
This visualization can be found in the following series:Tapes
This visualization originally appeared on the following tapes:-
Las Vegas, 1972-2010
(ID: 2011092)
Monday, August 29, 2011 at 4:00AM
Produced by - Walt Feimer (HTSI)
Datasets used in this visualization
-
[Landsat]
ID: 47
Note: While we identify the data sets used in these visualizations, we do not store any further details, nor the data sets themselves on our site.
Related
- ID: 10715
 Produced Video