Vegetation Response to Lower Colorado River pulse flow in 2014
Using data from NASA/USGS satellite Landsat 8, scientists have measured how vegetation in the Colorado River Delta has responded to the pulse of water released in March 2014 as part of the Minute 319 bi-national agreement.
For complete transcript, click here.
Watch this video on the NASA Goddard YouTube channel.
It was 2000 the last time the Colorado River reached the Sea of Cortez, and over that time there has been a decline in the amount of healthy vegetation along the lower reaches of the river.
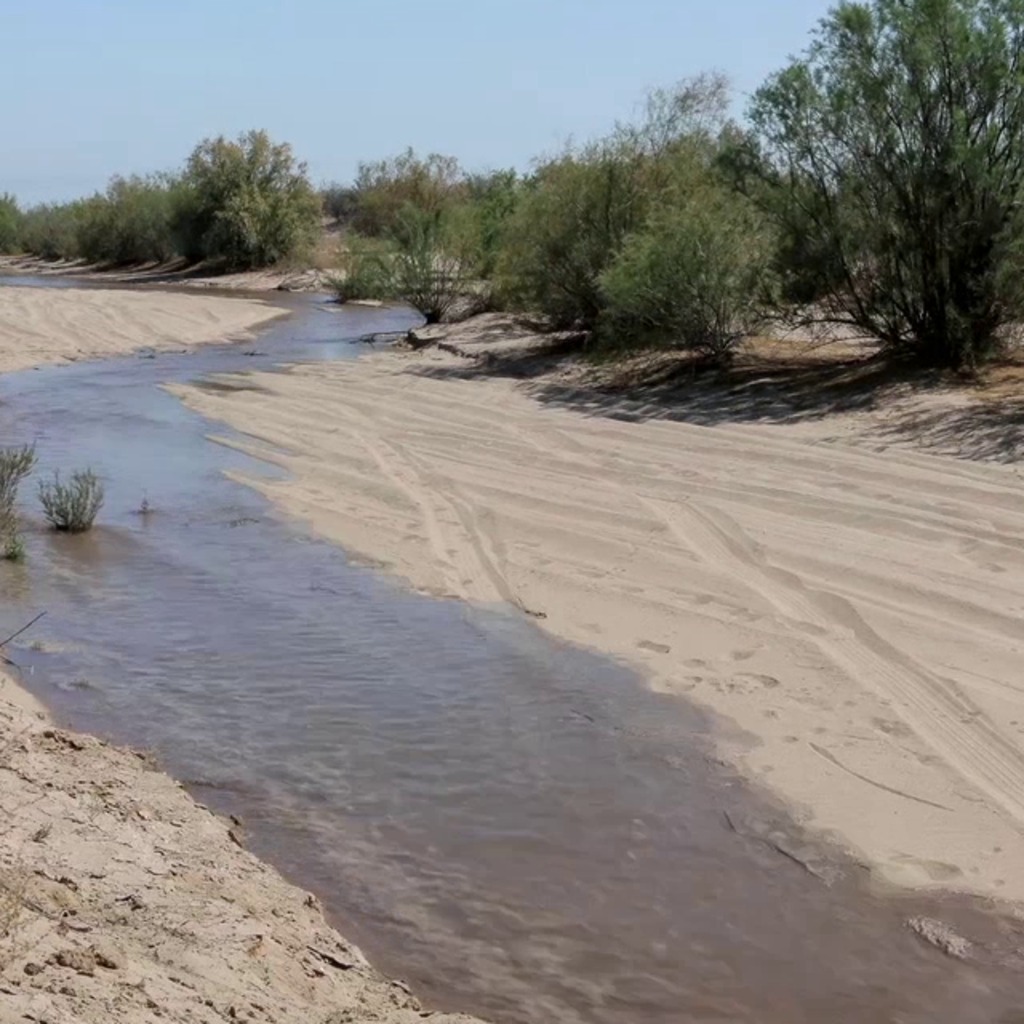
In 2014, the U.S. and Mexico made an agreement, known as Minute 319, to release an experimental flow through the Morelos Dam and down the riverbed. On March 23rd, the floodgates were opened and the water started to flow.
In total, 130 milion cubic meters (105,000 acre-feet) of water was sent through the dam. Though most of the water soaked into the ground in the first 37 miles, a portion of the flow did make it down to the delta. Water flowing on the surface reached areas that had been targeted for restoration, and the replenished groundwater revived vegetation along the entire route to the sea.
Pamela Nagler, of the U.S. Geological Survey’s Southwest Biological Science Center in Tucson, Arizona, compared satellite images of pre-flow August 2013 to post-flow August 2014. Using data from NASA/USGS's Landsat satellite, as well as data from NASA's Terra satellite, she calculated a 43 percent increase in green vegetation along the route wetted by the flow, called the inundation zone, and a 23 percent increase in greening of the overall river bed from bank to bank, called the riparian zone.
The Minute 319 pulse flow was the result of significant cooperation between a large group of partner organizations and agencies in the U.S. and Mexico, including the International Boundary and Water Commission, the U.S. Bureau of Reclamation, the USGS, the Sonoran Institute, the Environmental Defense Fund, the Mexican Comision Nacional de Areas Naturales Protegidas, and others.

Increase in vegetation in Colorado River Delta as a result of the Minute 319 pulse flow. This image shows the Normalized Difference Vegetation Index (NDVI) using Landsat 8 data from August 15, 2014, minus August 12, 2013.
Increase in vegetation in Colorado River Delta as a result of the Minute 319 pulse flow. This image shows Normalized Difference Vegetation Index (NDVI) using Landsat 8 data from August 15, 2014, minus August 12, 2013.
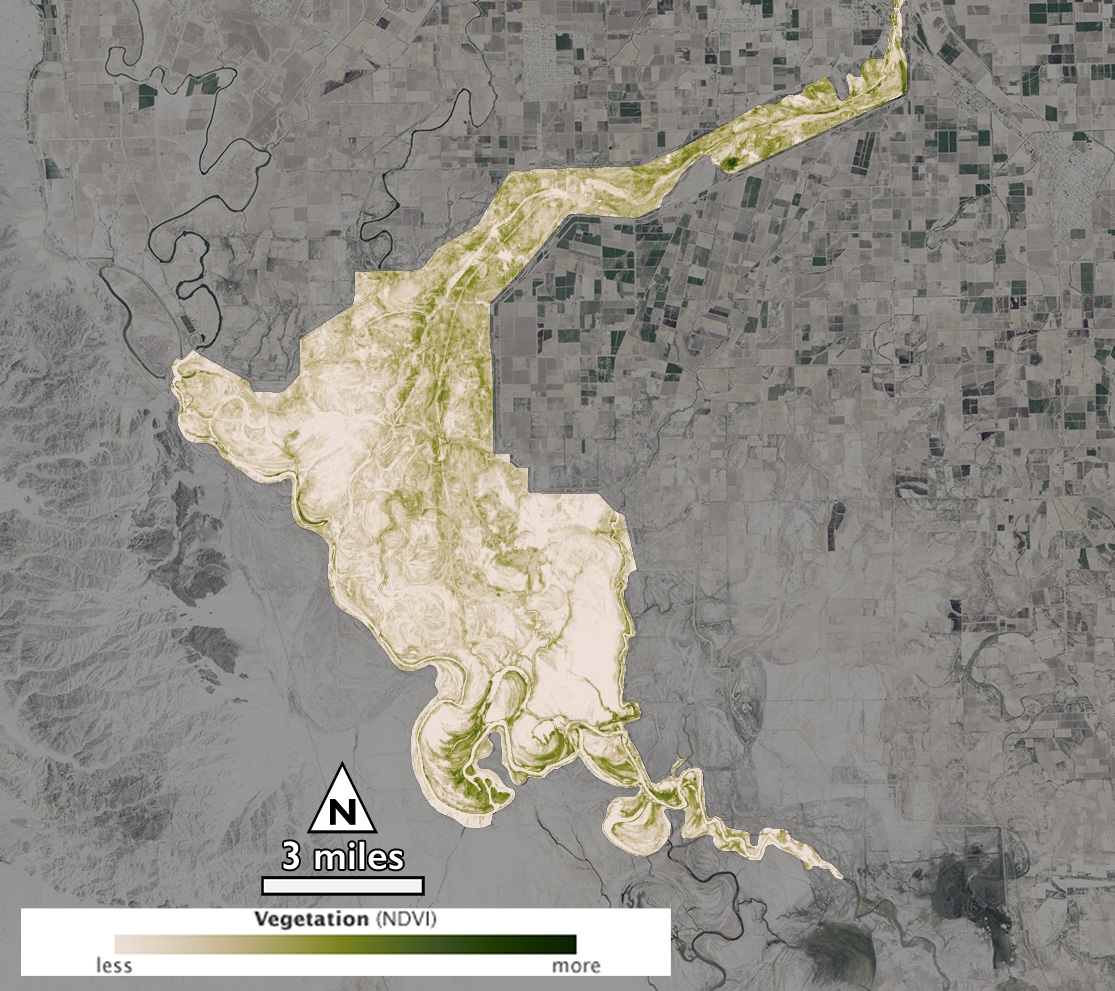
Amount and health of vegetation in the Colorado River Delta on August 12, 2013, several months before the Minute 319 pulse flow. Data is from Landsat 8, showing the Normalized Difference Vegetation Index (NDVI).
Amount and health of vegetation in the Colorado River Delta on August 12, 2013, several months before the Minute 319 pulse flow. Data is from Landsat 8, showing the Normalized Difference Vegetation Index (NDVI).
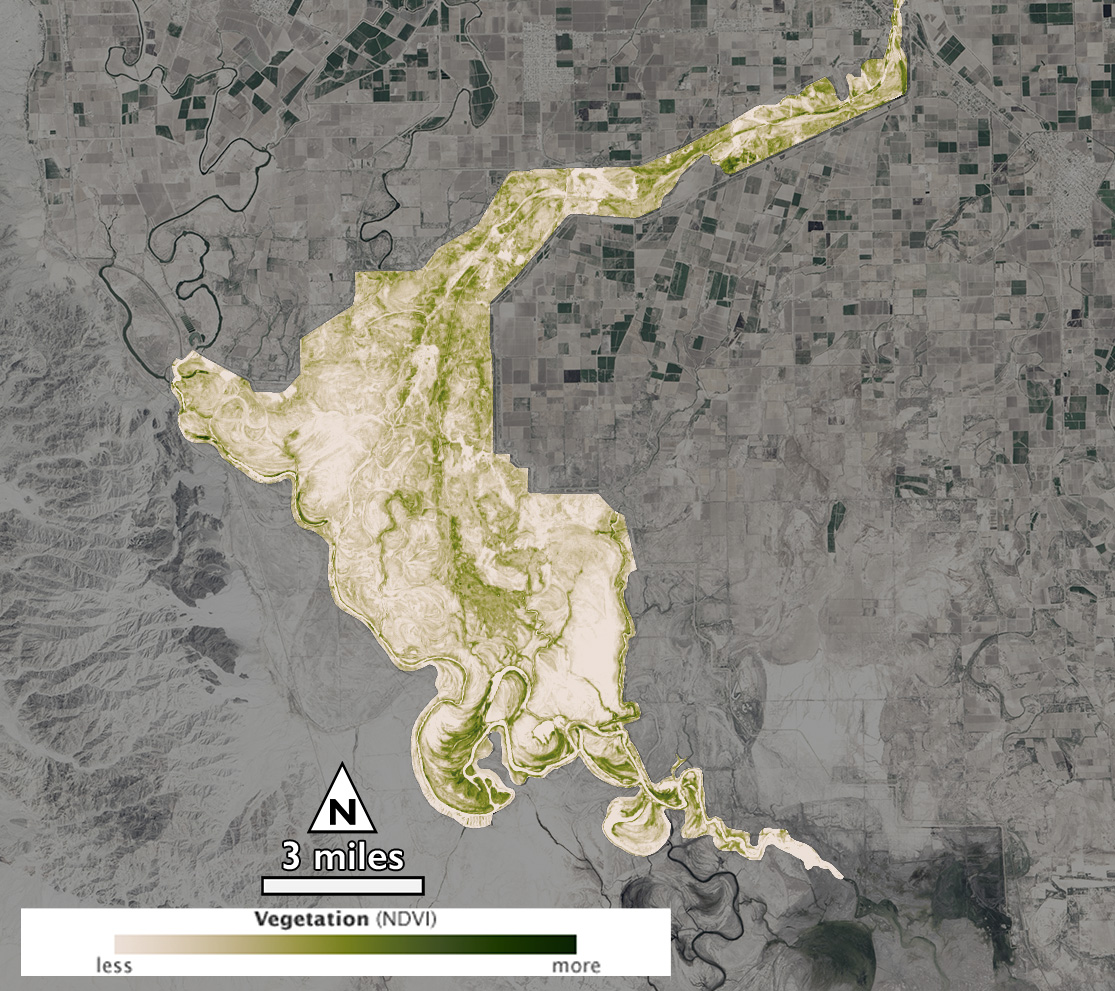
Amount and health of vegetation in the Colorado River Delta on August 15, 2014, several months after the Minute 319 pulse flow. Data is from Landsat 8, showing the Normalized Difference Vegetation Index (NDVI).
Amount and health of vegetation in the Colorado River Delta on August 15, 2014, several months after the Minute 319 pulse flow. Data is from Landsat 8, showing the Normalized Difference Vegetation Index (NDVI).
For More Information
See the following sources:
Credits
Please give credit for this item to:
NASA's Goddard Space Flight Center.
-
Producer
- Matthew R. Radcliff (USRA)
-
Animator
- Jesse Allen (Sigma Space Corporation)
-
Writer
- Kate Ramsayer (Telophase)
-
Scientists
- James R. Irons (NASA/GSFC)
- Pamela Nagler (USGS)
Release date
This page was originally published on Wednesday, December 17, 2014.
This page was last updated on Wednesday, May 3, 2023 at 1:50 PM EDT.
Series
This visualization can be found in the following series:Related
- ID: 10600
 Produced Video